MCP 功能
在你设置好 MCP 应用并登录后,你可以用日常语言要求 Claude(或其他 MCP 主机)查询你的 OpenReplay 数据。本页列出了 MCP 目前提供的功能,并为每项功能给出了示例提示。
搜索和筛选会话
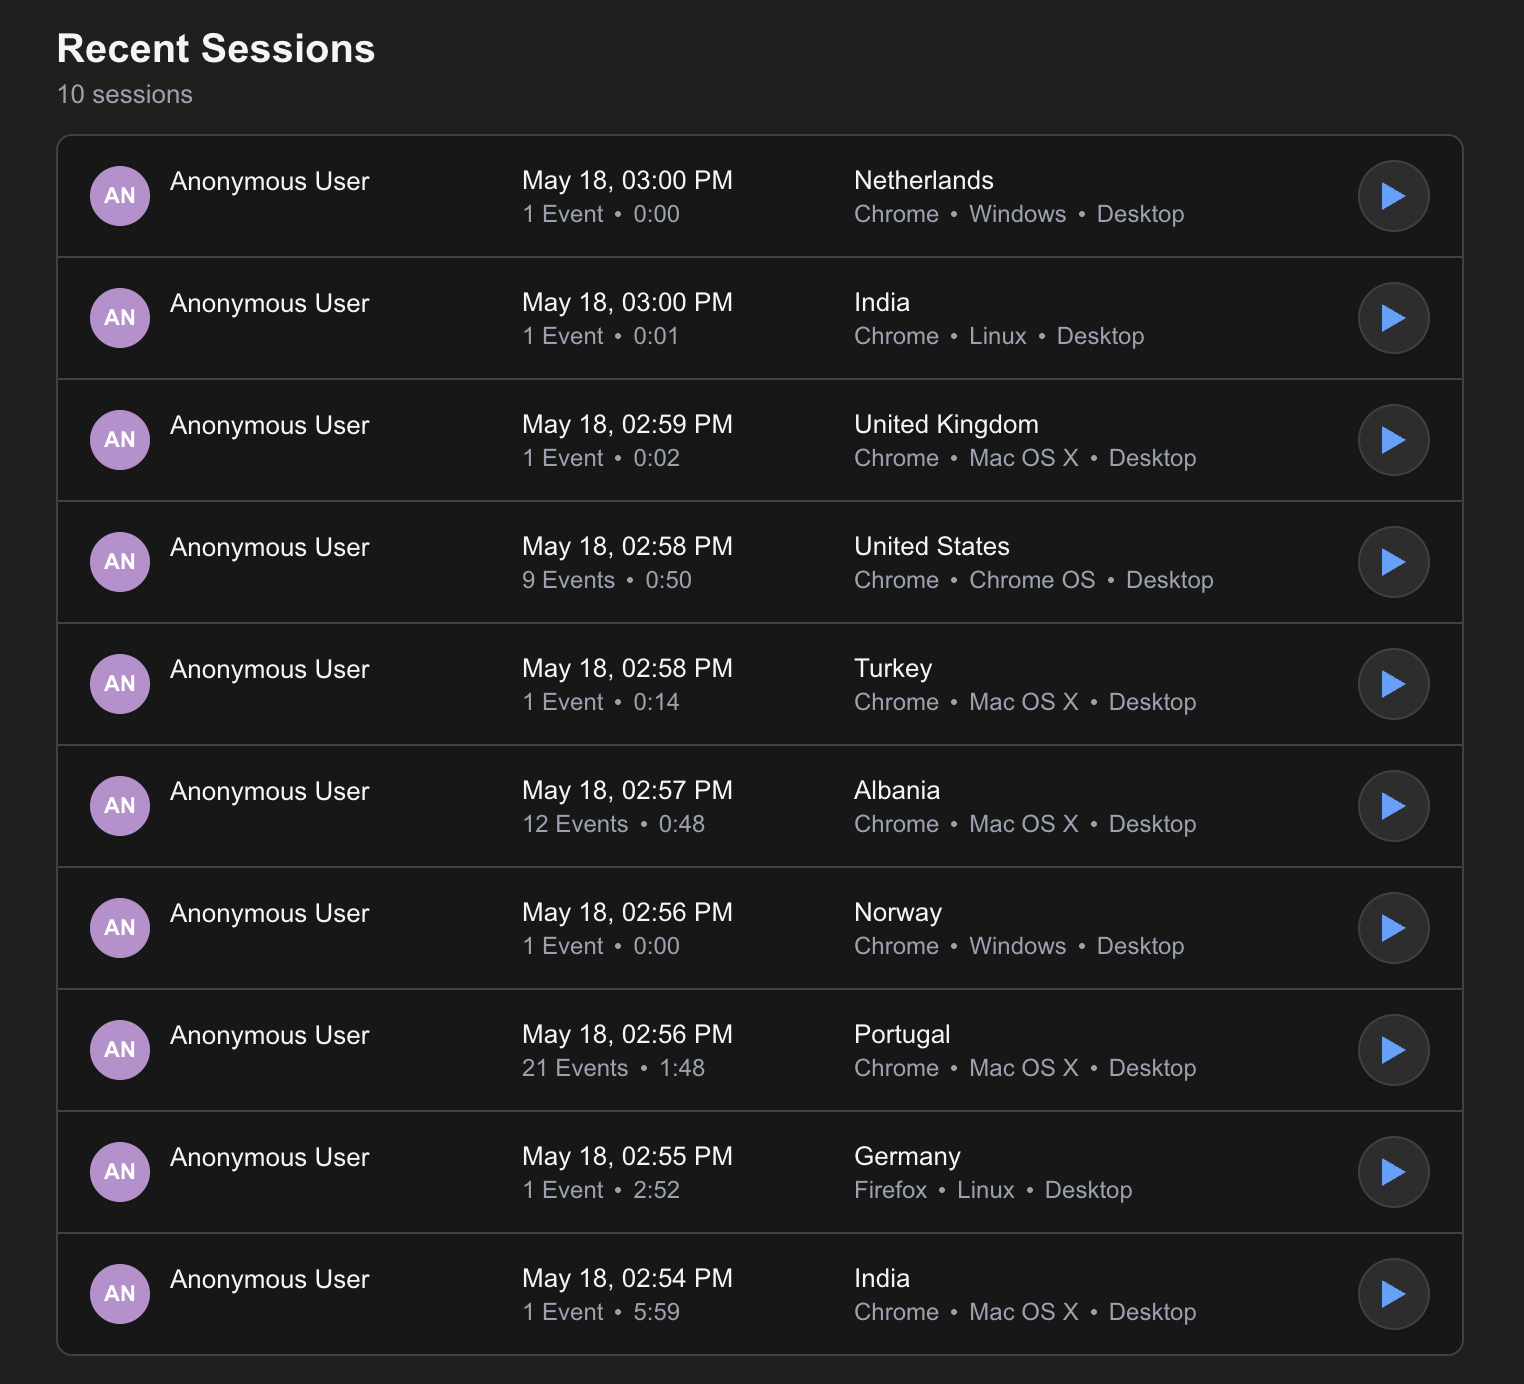
Section titled 搜索和筛选会话MCP 支持 OpenReplay 界面中提供的相同筛选条件:浏览器、操作系统、设备、国家、URL 路径、点击、输入、网络请求、错误、元数据、用户 ID 和时长。
Show me 20 recent sessions in MyAppSessions from Chrome users in France or TunisiaSessions with failed requests to /api/users in MyAppSessions where the user visited the signup page then clicked "Subscribe"Sessions longer than 20 minutes for user tahay@asayer.io结果会以交互式列表的形式呈现在聊天中,因此你可以点击进入任意会话。
以时间序列图表呈现
Section titled 以时间序列图表呈现Show me the sessions chart for last week in MyAppSession trend for the past 30 days from FranceChart of sessions from mobile users this monthTimeseries of users who visited /signup last week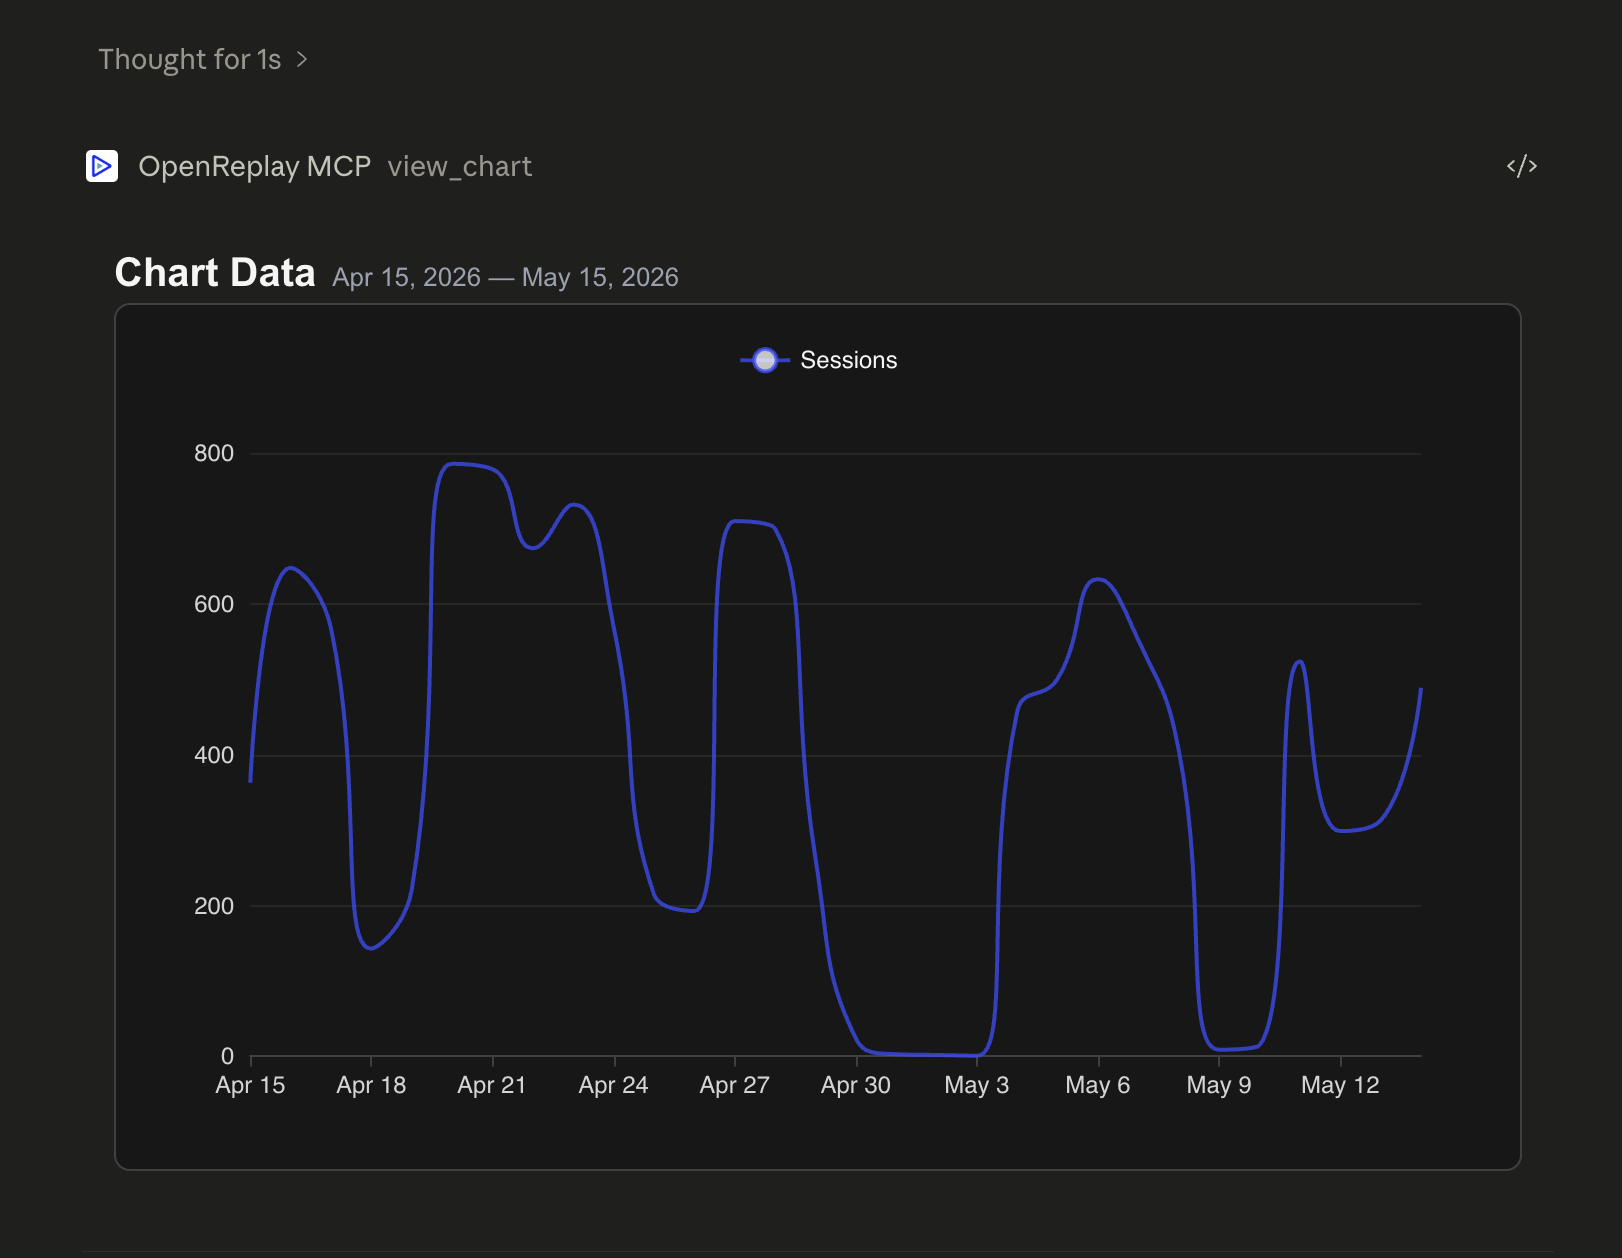
漏斗用于衡量一系列 URL、点击、输入或自定义事件中的转化情况。流失会逐步显示。
Show me the checkout funnel last week: /cart → /checkout → /confirmConversion from /pricing to /signup this monthVisited /pricing then clicked SubscribePage view /checkout followed by a JS exception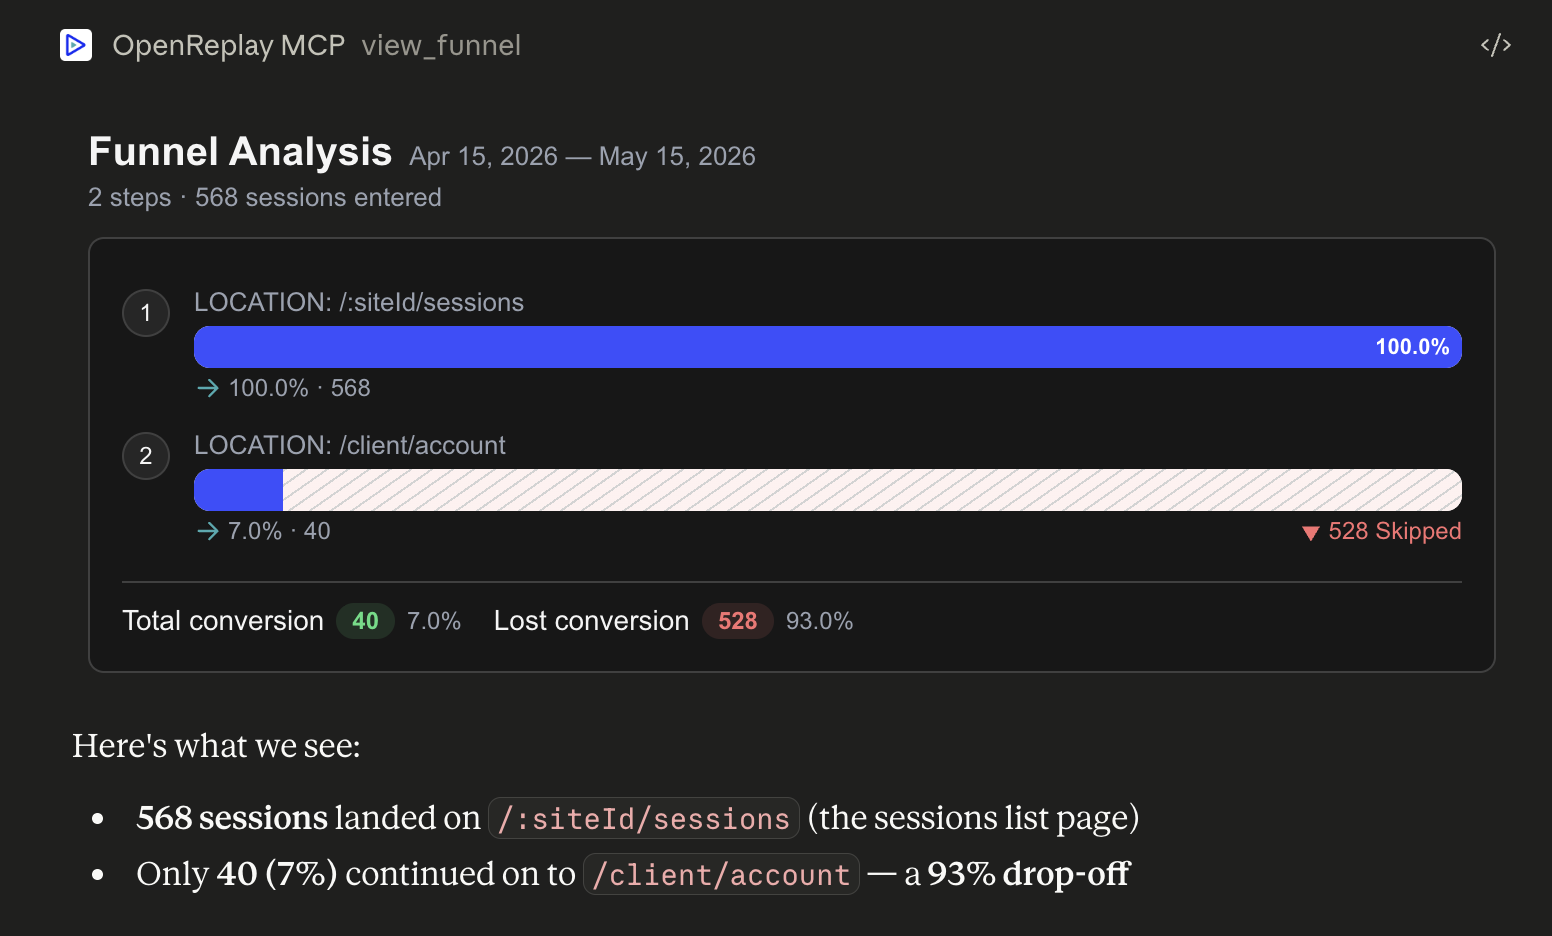
X 排行榜
Section titled X 排行榜找出访问量最高的页面、热门浏览器、热门国家、热门操作系统、热门设备或热门网络请求。
What are the top visited pages this week?Show browser distribution this monthMost popular countries last 30 daysTop 5 network requests today in MyApp了解用户如何在你的产品中导航——他们落在哪些页面、接下来去往何处、在哪里流失。
Show me user journeys this monthWhere do users drop off after the pricing page last week?What pages do users visit after /signup?Navigation paths for mobile users from France this weekWeb Vitals 与性能
Section titled Web Vitals 与性能核心 Web Vitals(LCP、FID、CLS)和性能指标,可按细分群体切分查看。
Show me web vitals for this weekHow is my site performance past month?Core web vitals for mobile usersPerformance metrics for Chrome on Windows for user tahay@asayer.io观看会话回放
Section titled 观看会话回放回放会在聊天中内嵌的播放器里呈现。你可以拖动进度、暂停和检查,就像在 OpenReplay 界面中一样。
Show me the replay of session 7891234567890Replay the last session in the list above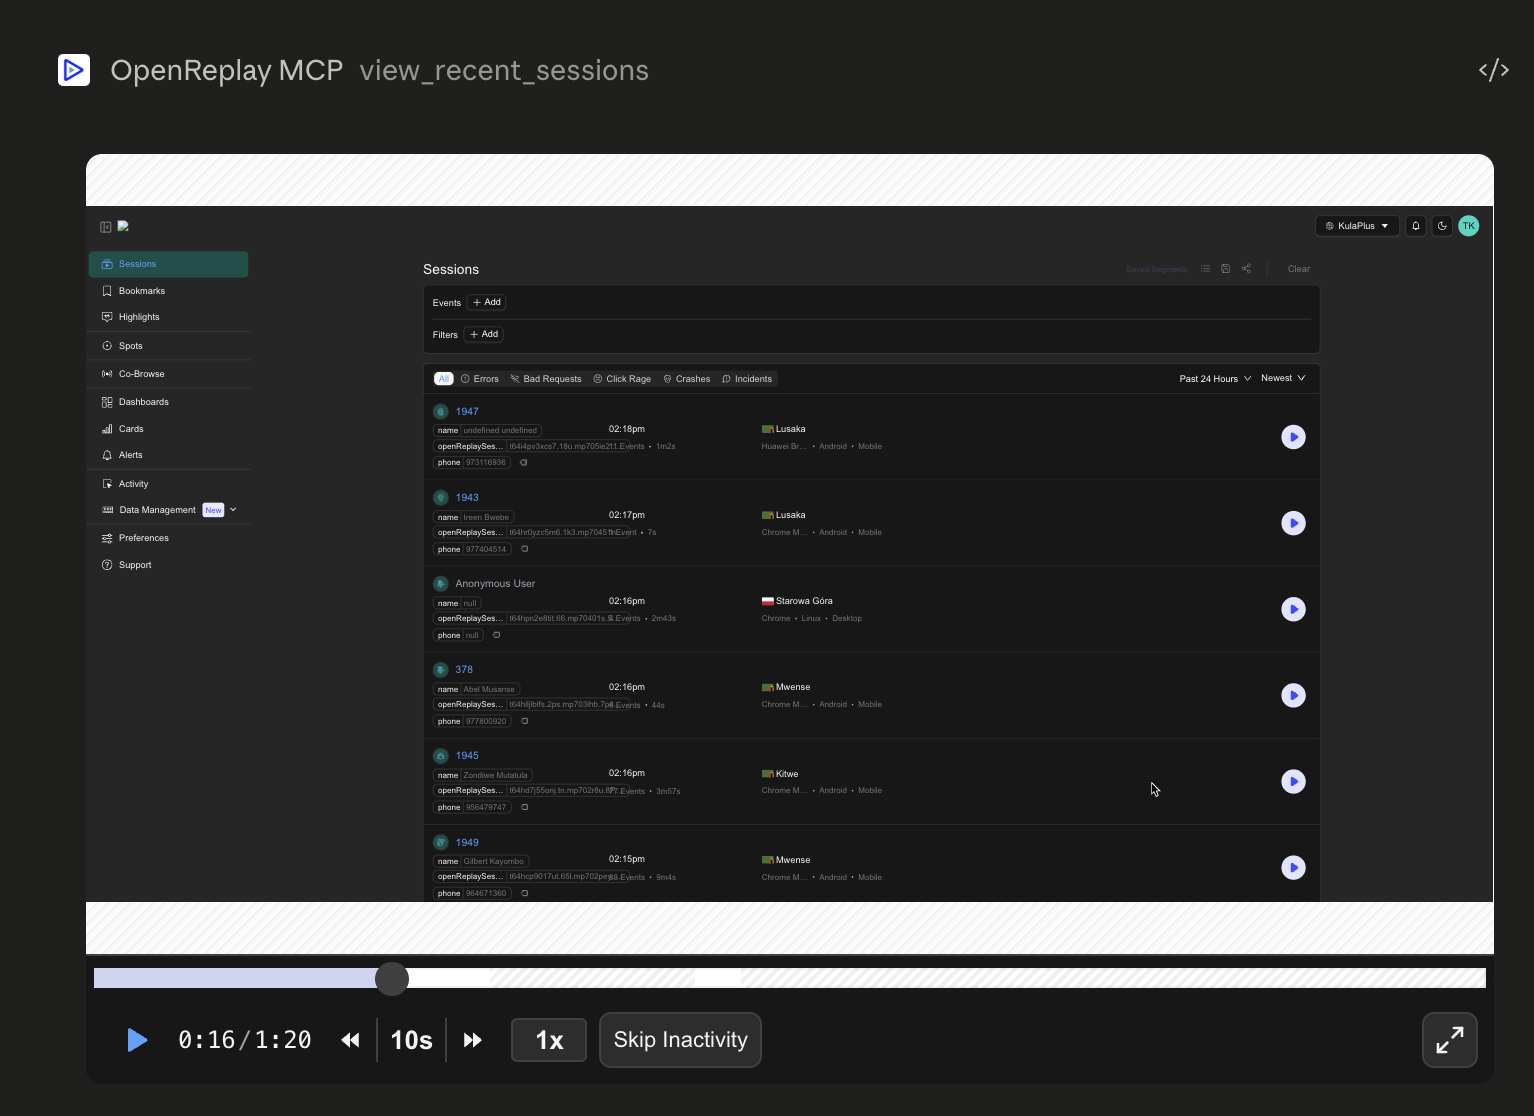
真正的价值来自将多个工具串联起来。一些示例:
- “Find sessions where users hit a JS exception on /checkout this week, then show me the replay of the most recent one and tell me what happened.”
- “Pull the funnel for /pricing → /signup → /dashboard, then for the step with the biggest drop-off show me 5 sessions that dropped off there.”
- “Plot the timeseries of sessions from France this month. If there’s a spike, find a few sessions from that day and summarize what they did.”
由于 Claude 能够在各次工具调用之间对结果进行推理,你可以始终停留在对话层面,而无需在各个仪表板之间来回切换。