MCP Capabilities
Once you’ve set up the MCP app and logged in, you can ask Claude (or another MCP host) to query your OpenReplay data in plain English. This page lists what the MCP currently exposes, with example prompts for each.
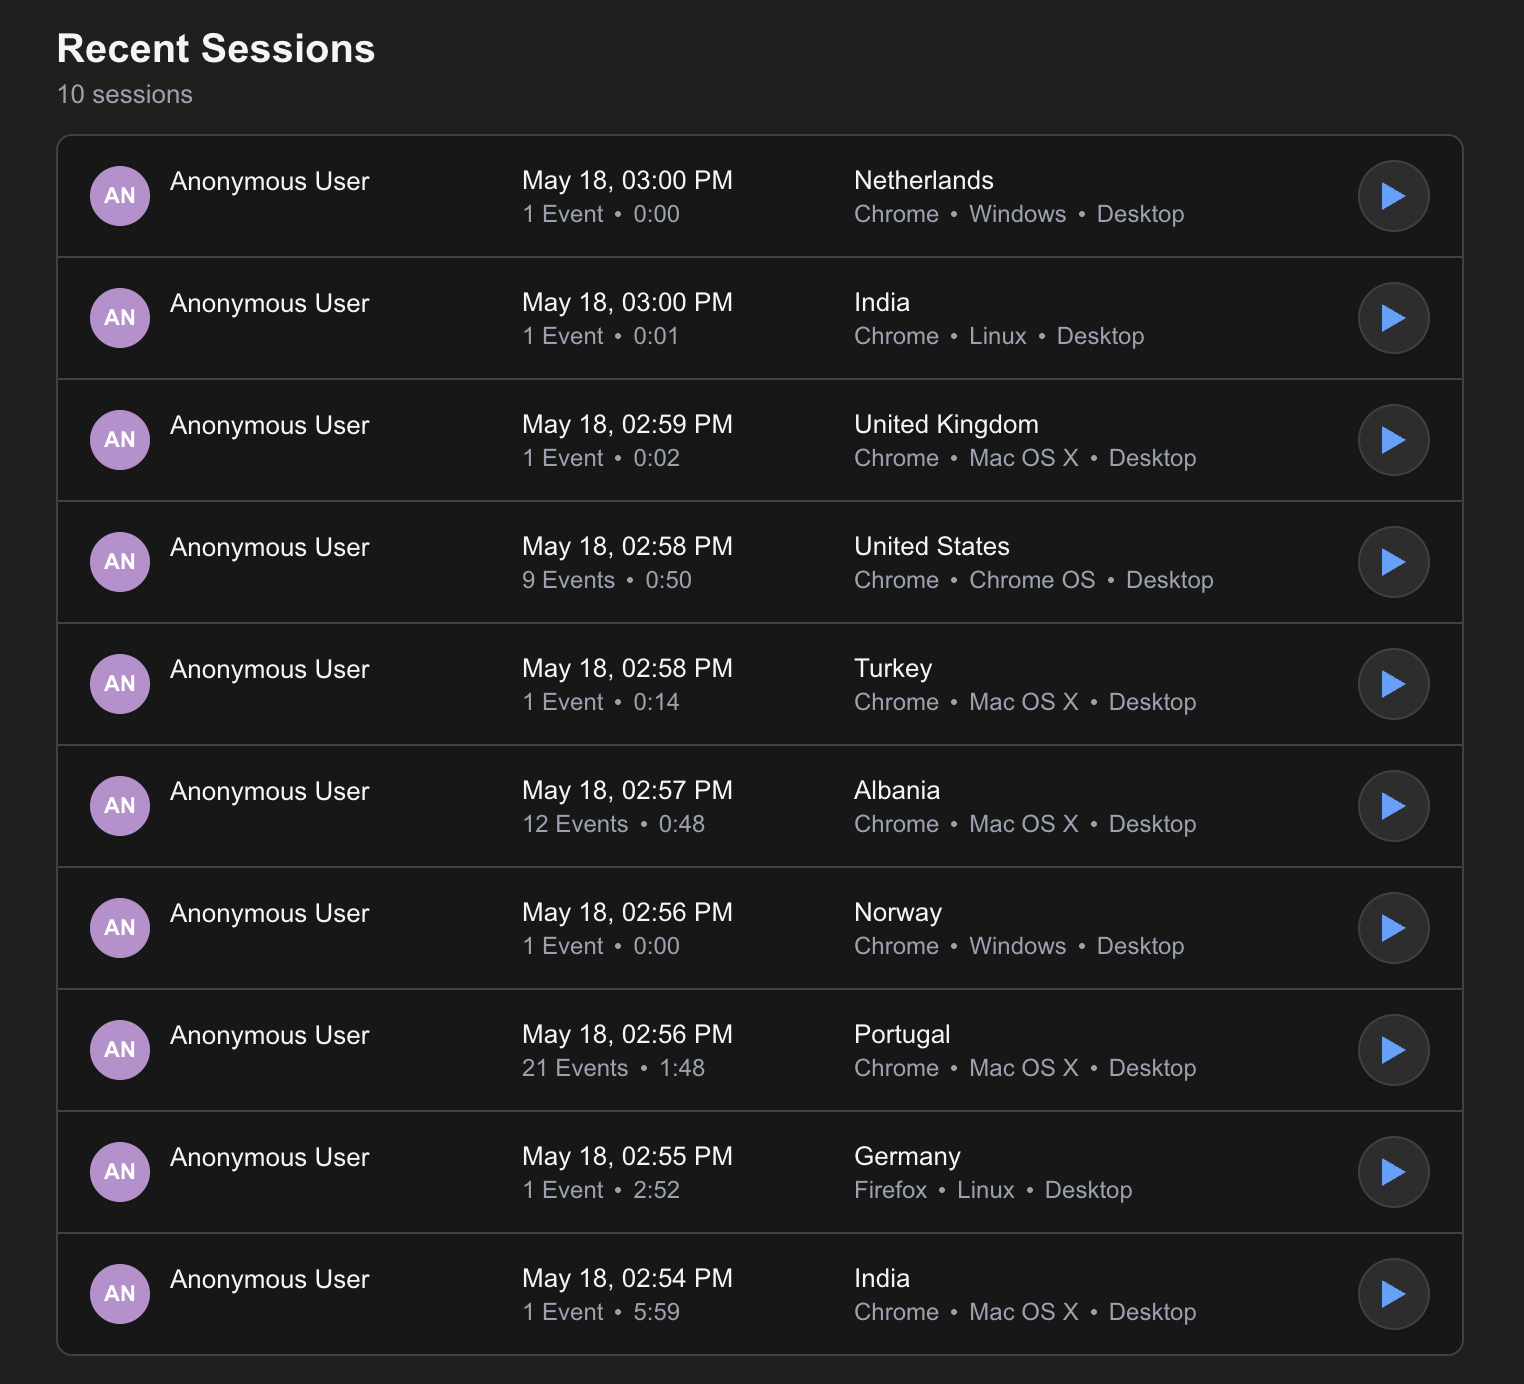
Search and filter sessions
Section titled Search and filter sessionsThe MCP supports the same filters available in the OpenReplay UI: browser, OS, device, country, URL paths, clicks, inputs, network requests, errors, metadata, user IDs, and duration.
Show me 20 recent sessions in MyAppSessions from Chrome users in France or TunisiaSessions with failed requests to /api/users in MyAppSessions where the user visited the signup page then clicked "Subscribe"Sessions longer than 20 minutes for user tahay@asayer.ioThe result is rendered as an interactive list inside the chat, so you can click into any session.
Visualize as a timeseries chart
Section titled Visualize as a timeseries chartShow me the sessions chart for last week in MyAppSession trend for the past 30 days from FranceChart of sessions from mobile users this monthTimeseries of users who visited /signup last week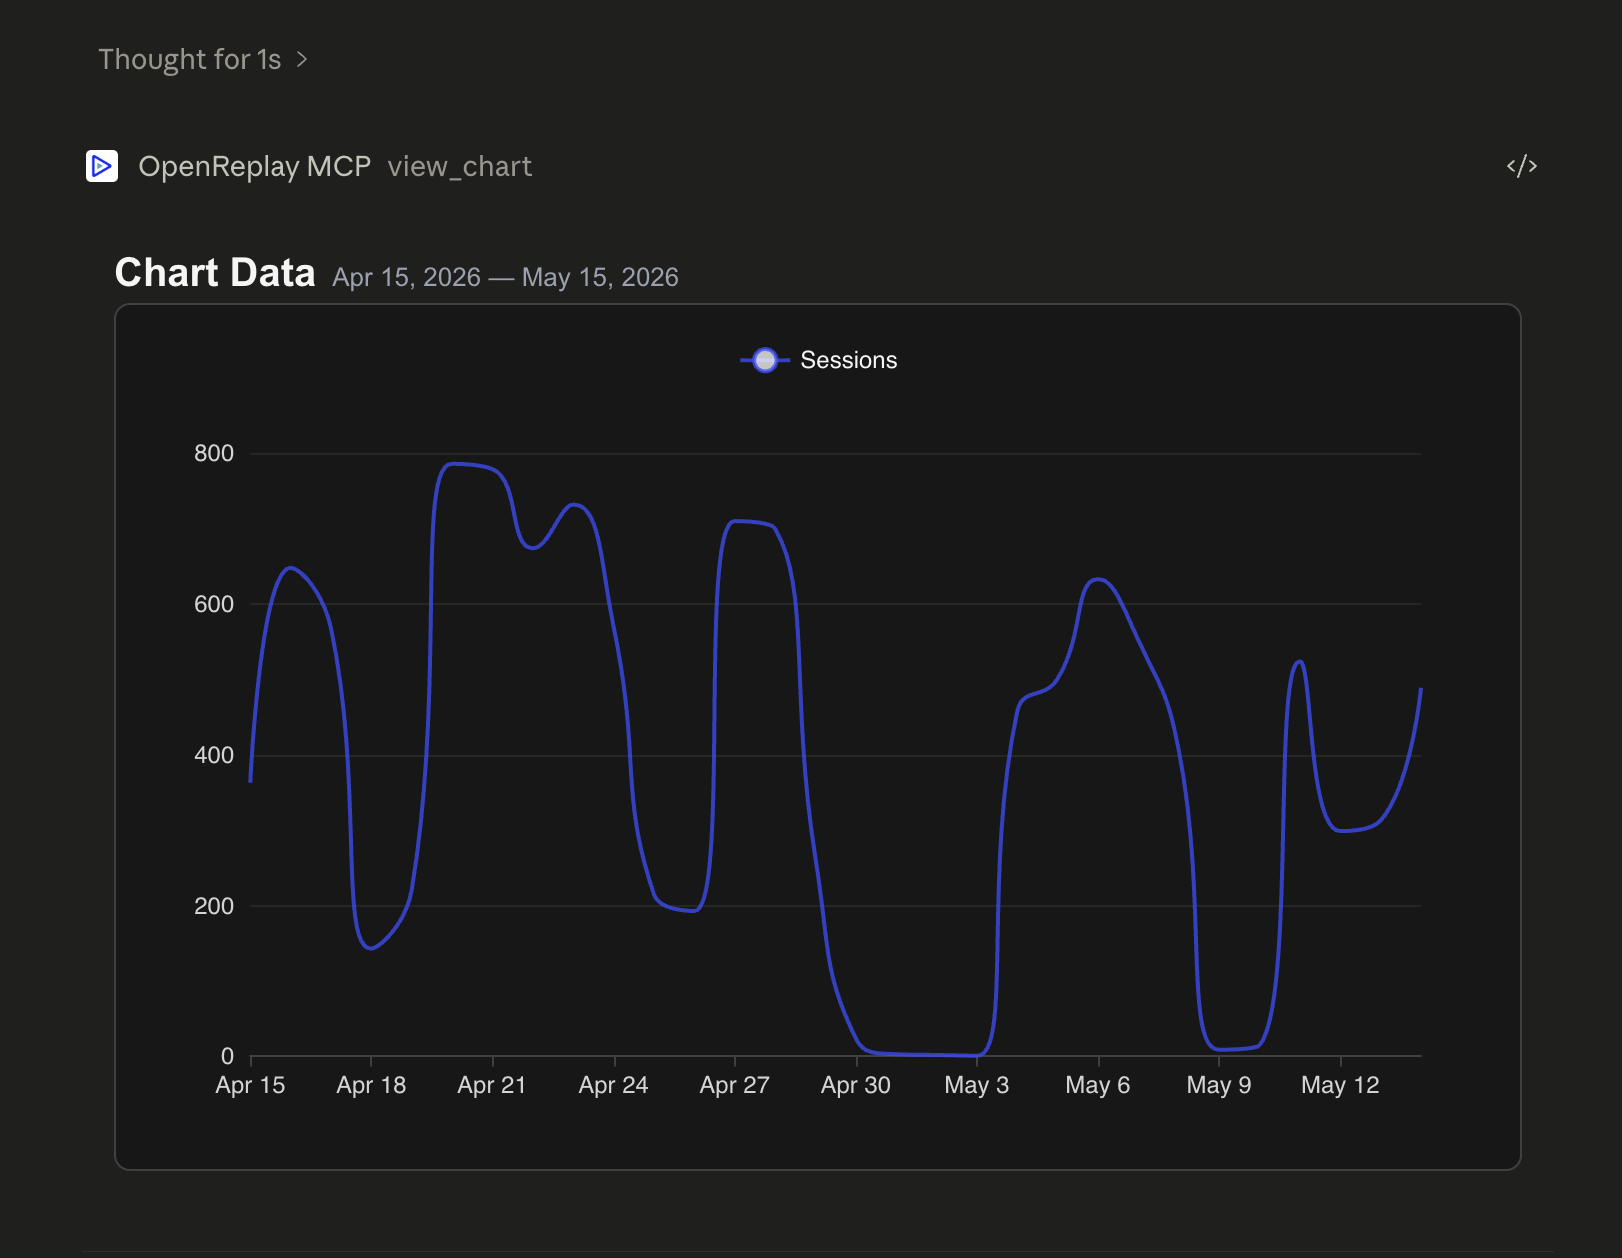
Funnels
Section titled FunnelsFunnels measure conversion across a series of URLs, clicks, inputs, or custom events. Drop-off is shown step by step.
Show me the checkout funnel last week: /cart → /checkout → /confirmConversion from /pricing to /signup this monthVisited /pricing then clicked SubscribePage view /checkout followed by a JS exception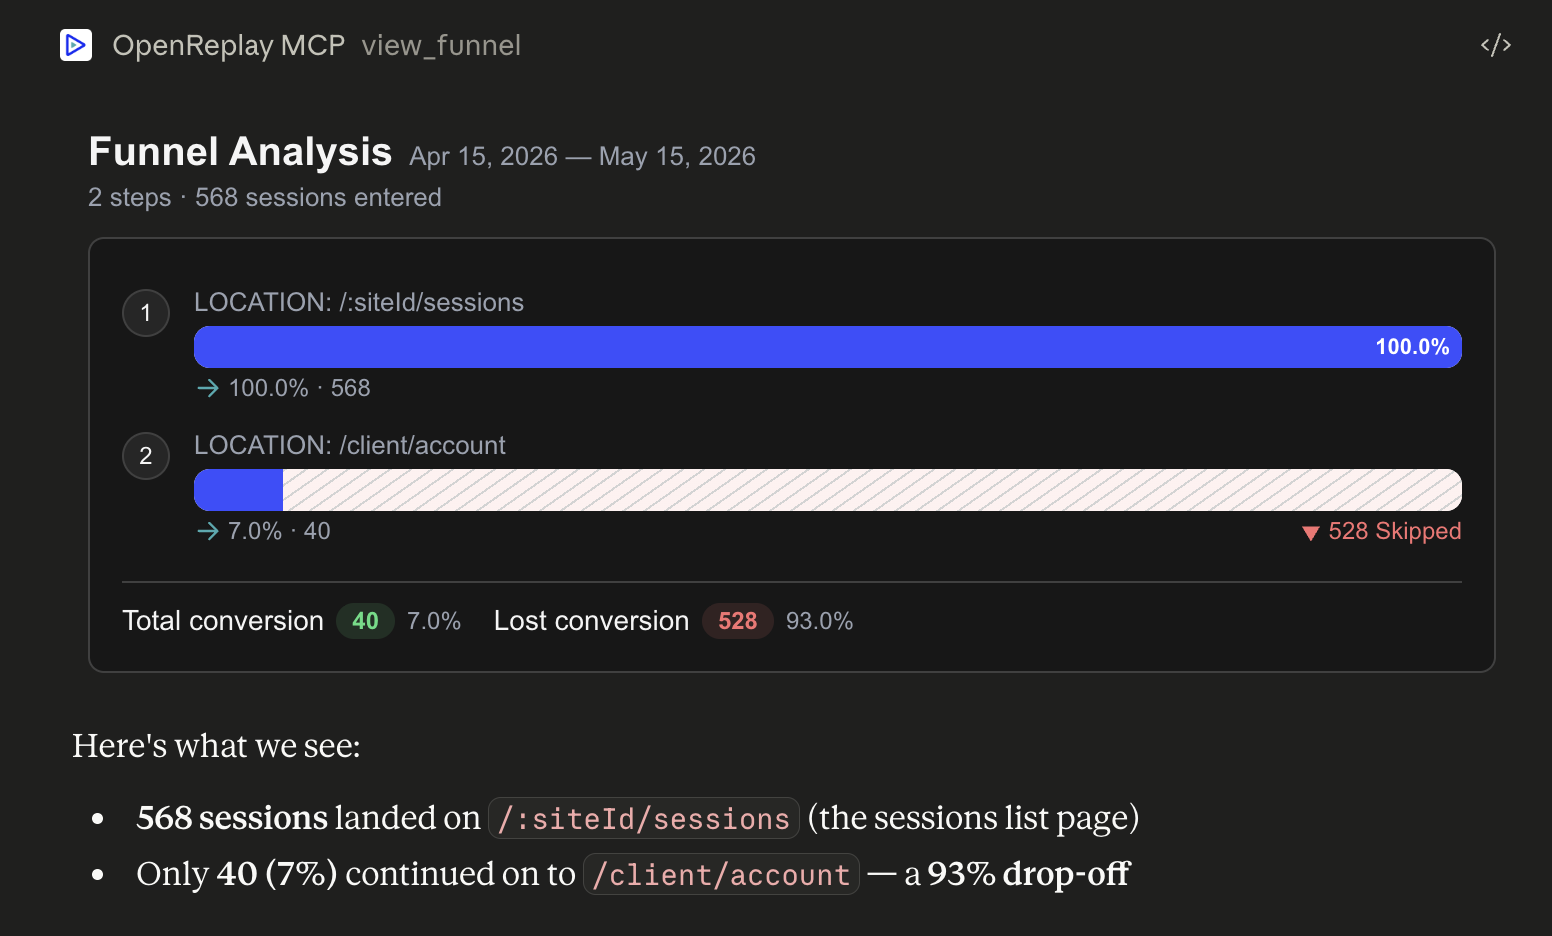
Top of X
Section titled Top of XFind the most-visited pages, top browsers, top countries, top OS, top devices, or top network requests.
What are the top visited pages this week?Show browser distribution this monthMost popular countries last 30 daysTop 5 network requests today in MyAppUser journeys
Section titled User journeysSee how users navigate through your product — what pages they land on, where they go next, where they drop off.
Show me user journeys this monthWhere do users drop off after the pricing page last week?What pages do users visit after /signup?Navigation paths for mobile users from France this weekWeb vitals and performance
Section titled Web vitals and performanceCore web vitals (LCP, FID, CLS) and performance metrics, sliced by segment.
Show me web vitals for this weekHow is my site performance past month?Core web vitals for mobile usersPerformance metrics for Chrome on Windows for user tahay@asayer.ioWatch a session replay
Section titled Watch a session replayReplays render in an embedded player inside the chat. You can scrub, pause, and inspect just like in the OpenReplay UI.
Show me the replay of session 7891234567890Replay the last session in the list above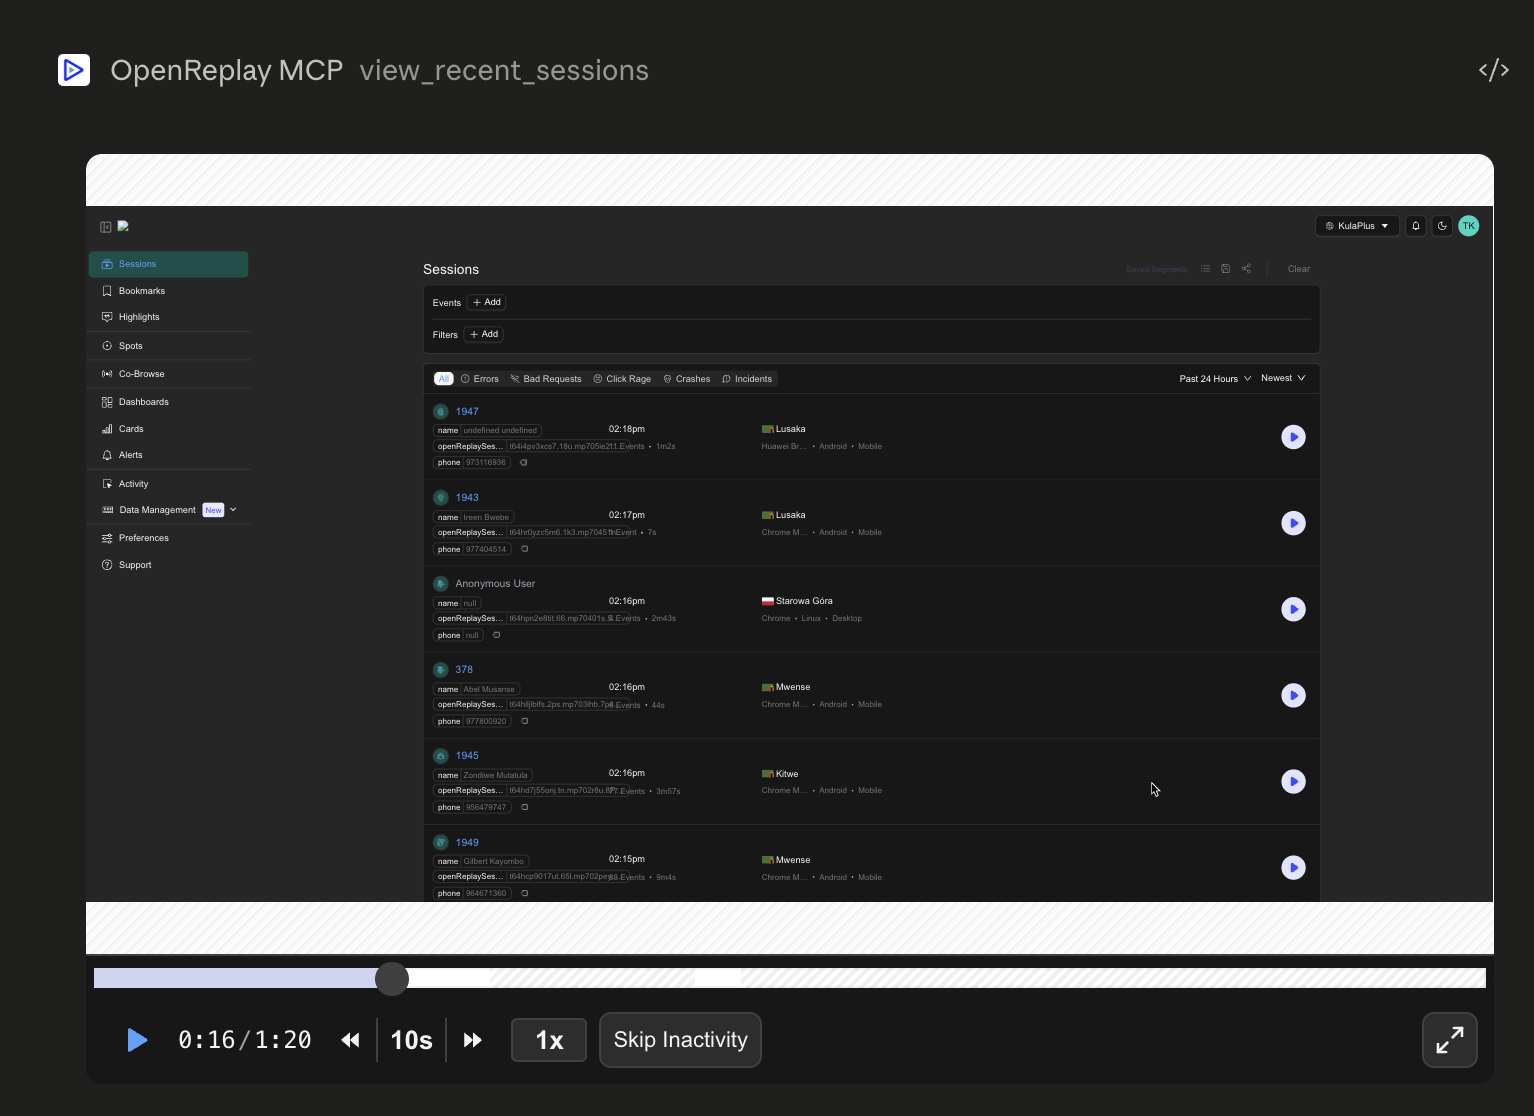
Mix and match
Section titled Mix and matchThe real value comes from chaining tools together. Some examples:
- “Find sessions where users hit a JS exception on /checkout this week, then show me the replay of the most recent one and tell me what happened.”
- “Pull the funnel for /pricing → /signup → /dashboard, then for the step with the biggest drop-off show me 5 sessions that dropped off there.”
- “Plot the timeseries of sessions from France this month. If there’s a spike, find a few sessions from that day and summarize what they did.”
Because Claude can reason over the results between tool calls, you can stay at the conversation level instead of jumping between dashboards.
Have questions?
Section titled Have questions?If you run into issues, join our Slack or post on the Forum.