Funnels
Funnels are designed to help you analyze and understand how users navigate through key steps in your product. Whether it’s tracking sign-up flows, checkout processes, or onboarding completion, funnels let you visualize the journey and pinpoint where users drop off.
Funnel use cases
Section titled Funnel use casesFunnels help answer critical questions like:
- How many users complete each step of the checkout process?
- Where do users drop off during onboarding?
- What is the drop-off rate between step X and step Y in the sign-up process?
- Which steps in the onboarding process cause the most drop-offs?
- Are mobile users dropping off at a specific step compared to desktop users?
Getting started with Funnels
Section titled Getting started with FunnelsCreate a new Funnel
Section titled Create a new FunnelYou can access Funnels within the Cards menu, under the category “Product Analytics.” Select “Funnels” to begin setting up and analyzing funnel steps.
Basic anatomy of Funnels
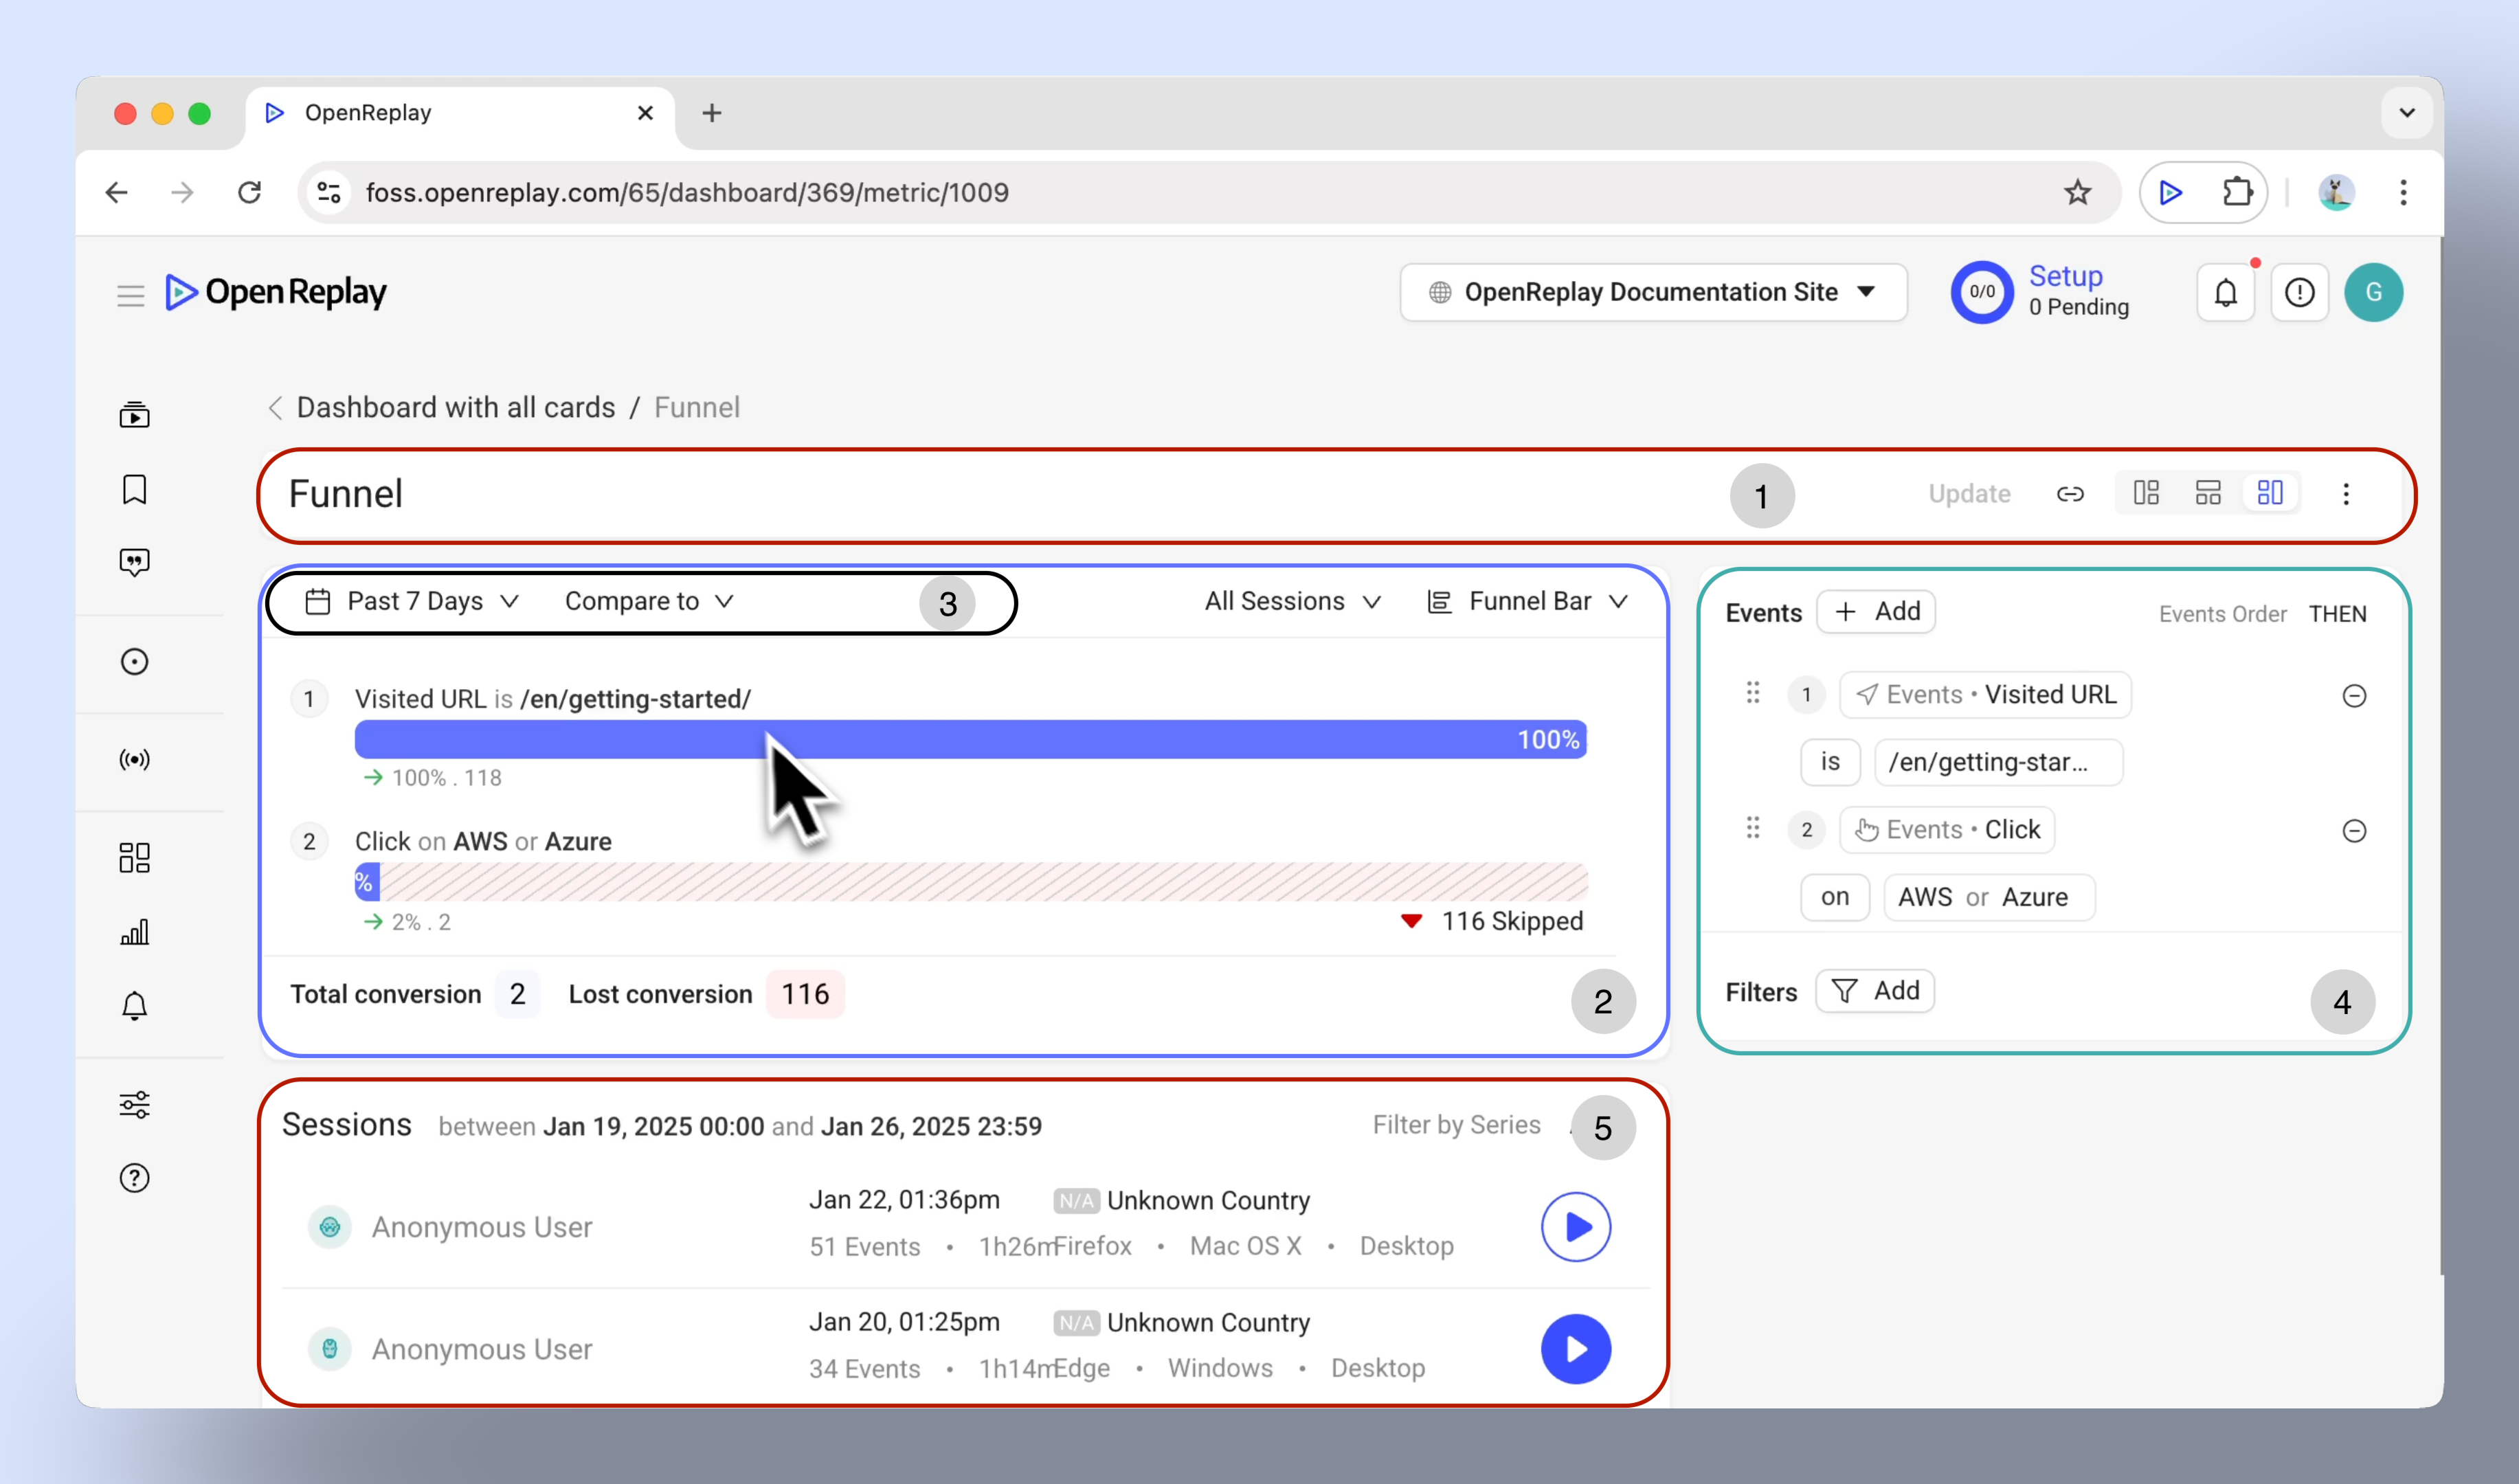
Section titled Basic anatomy of Funnels- Menu Bar: Change the display layout, rename, delete, or add the funnel card to a dashboard.
- Chart area: Visualize total conversions, conversions between steps, and users who skipped steps. See the total conversion and lost conversion through the entire funnel.
- Time range: Adjust the time period to analyze specific trends.
- Events and filters: Define events for each funnel step, combining user actions such as clicks, visited URLs, and inputs. Filters are applied across all defined events.
- Sessions list: Click on grayed-out sections to view sessions of users who dropped off at a particular step, and play replays to identify root causes.
Visualizing Funnels: chart types
Section titled Visualizing Funnels: chart types- Funnel bar chart: Best for visualizing step-by-step progression and drop-offs.
- Funnel column chart: Provides a vertical view of conversions and drop-offs.
- Metric: Highlights the overall conversion rate.
- Table: Displays detailed numbers for each step, including total sessions or users and overall conversion rate.
Customizing Funnel views
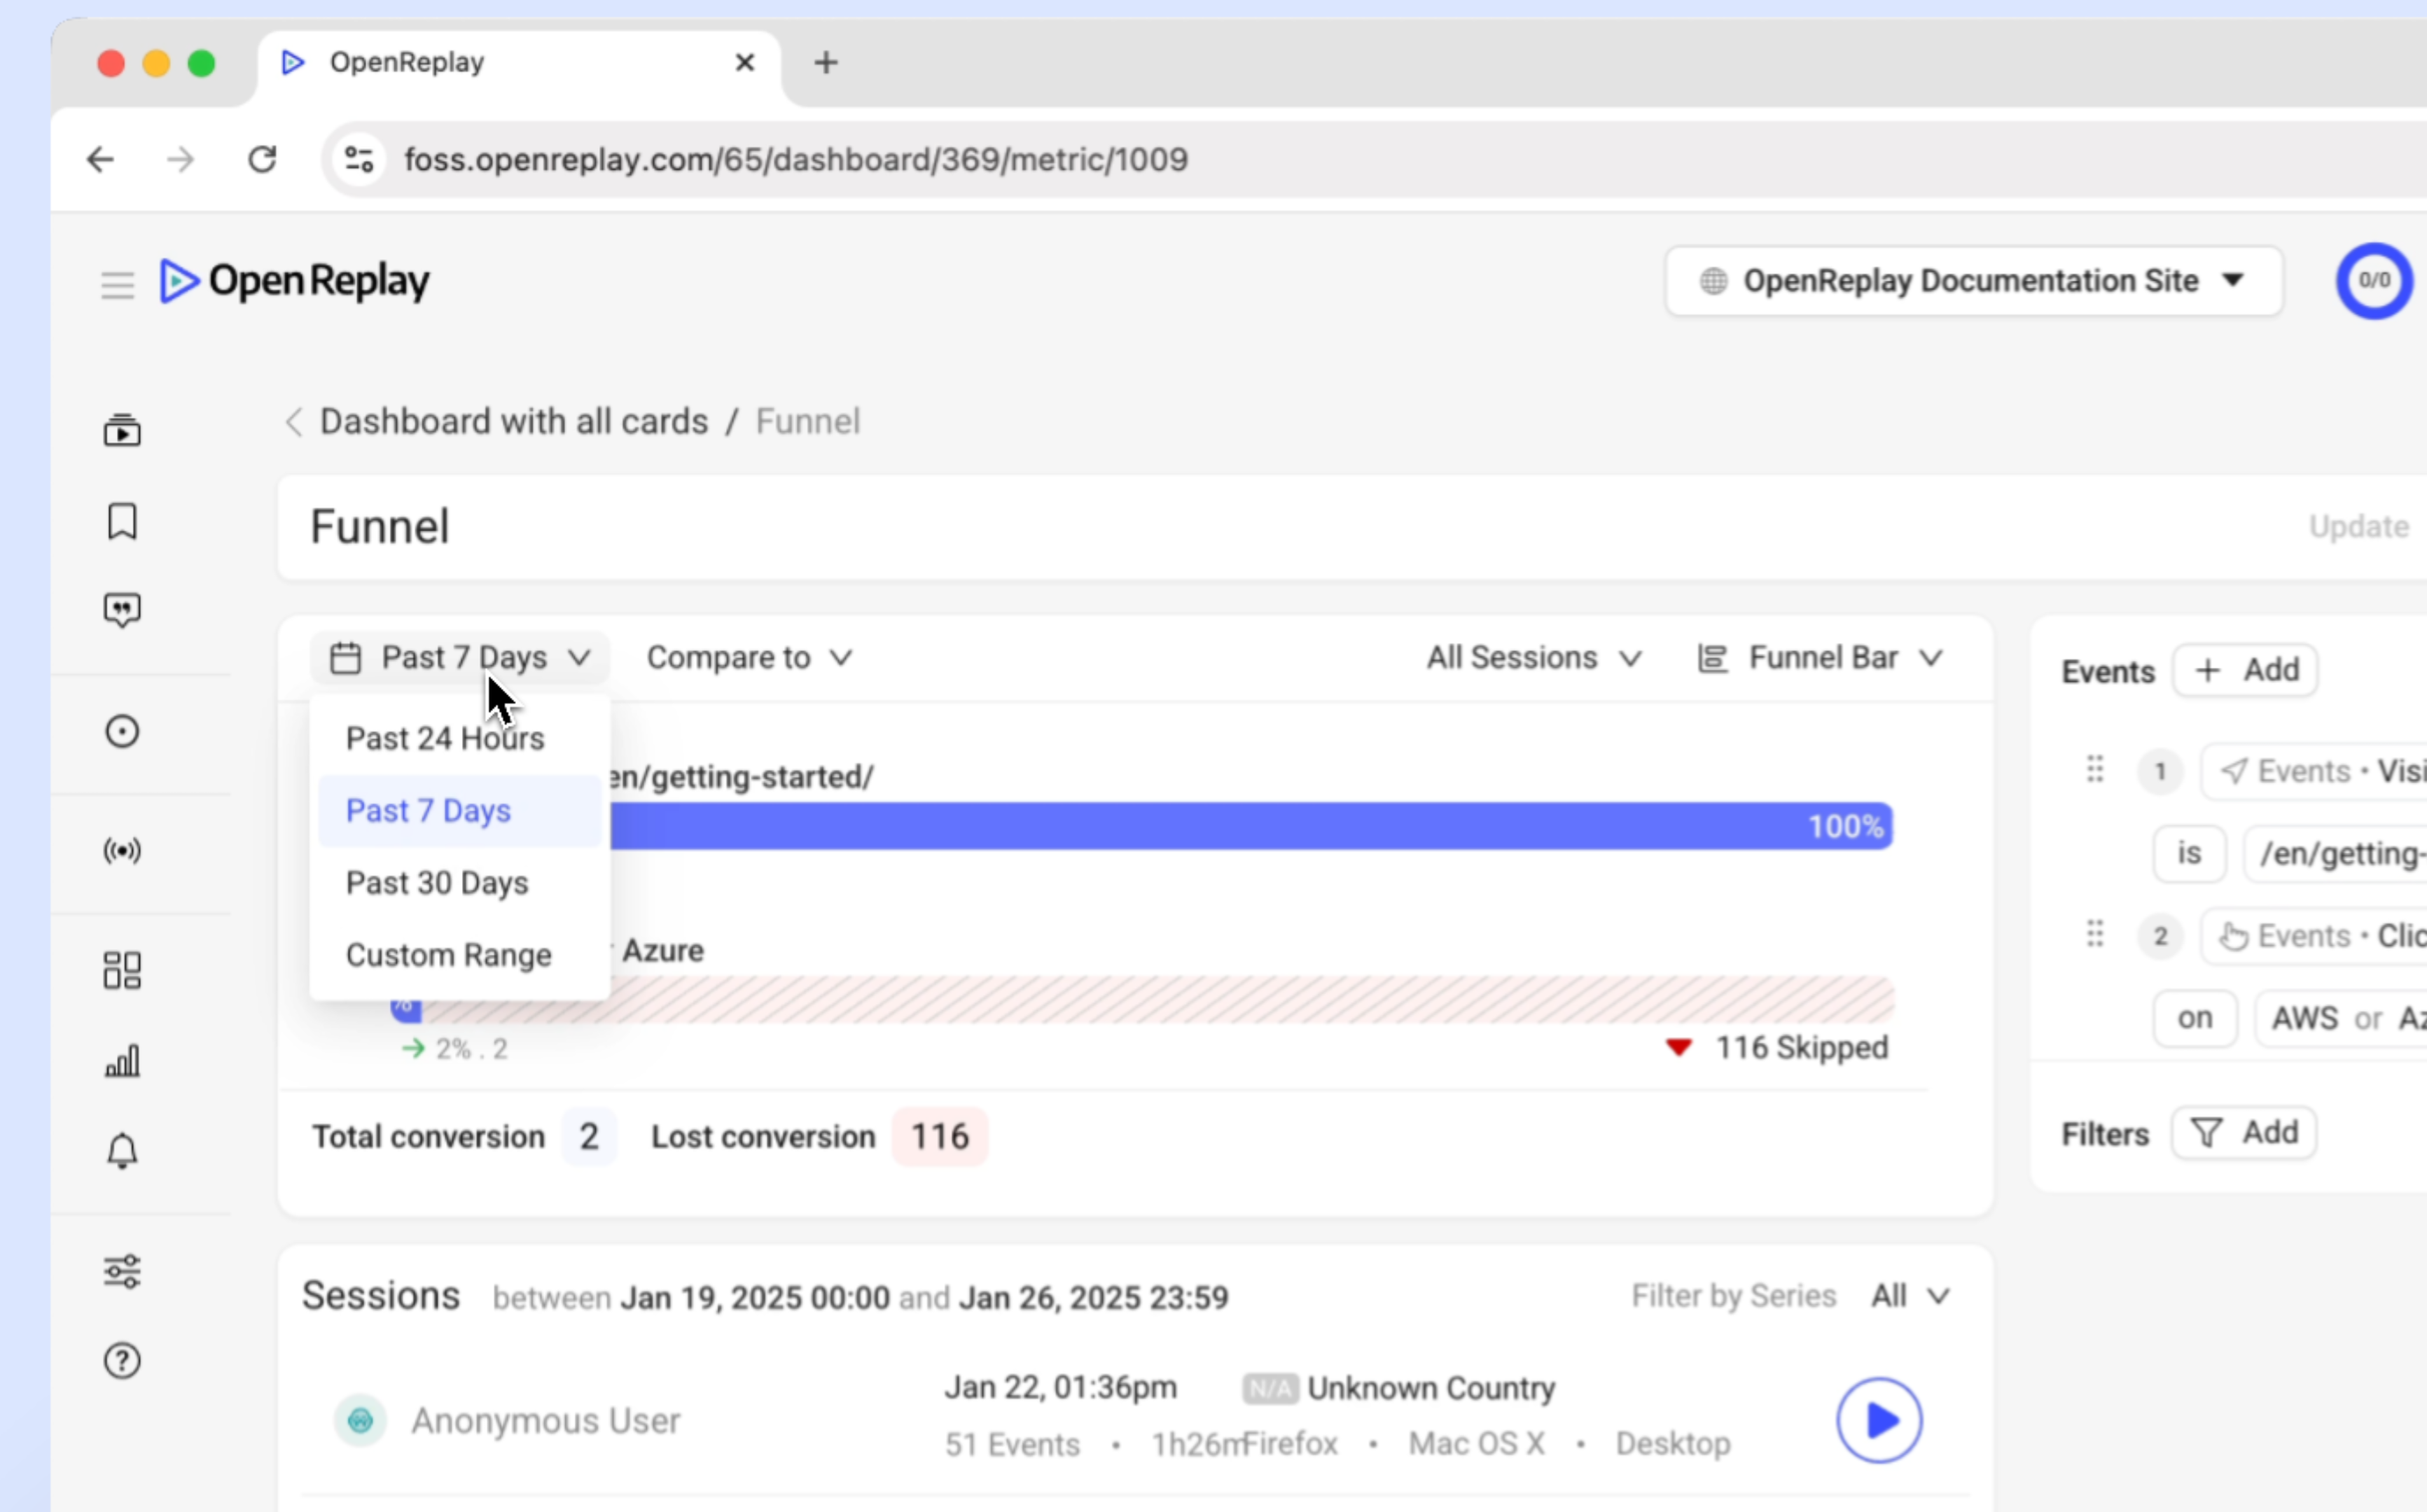
Section titled Customizing Funnel viewsAdjusting the Time Range
Section titled Adjusting the Time Range- Preset options: Analyze data from the Past 24 Hours, Past 7 Days, or Past 30 Days.
- Custom ranges: Define specific periods based on your needs.
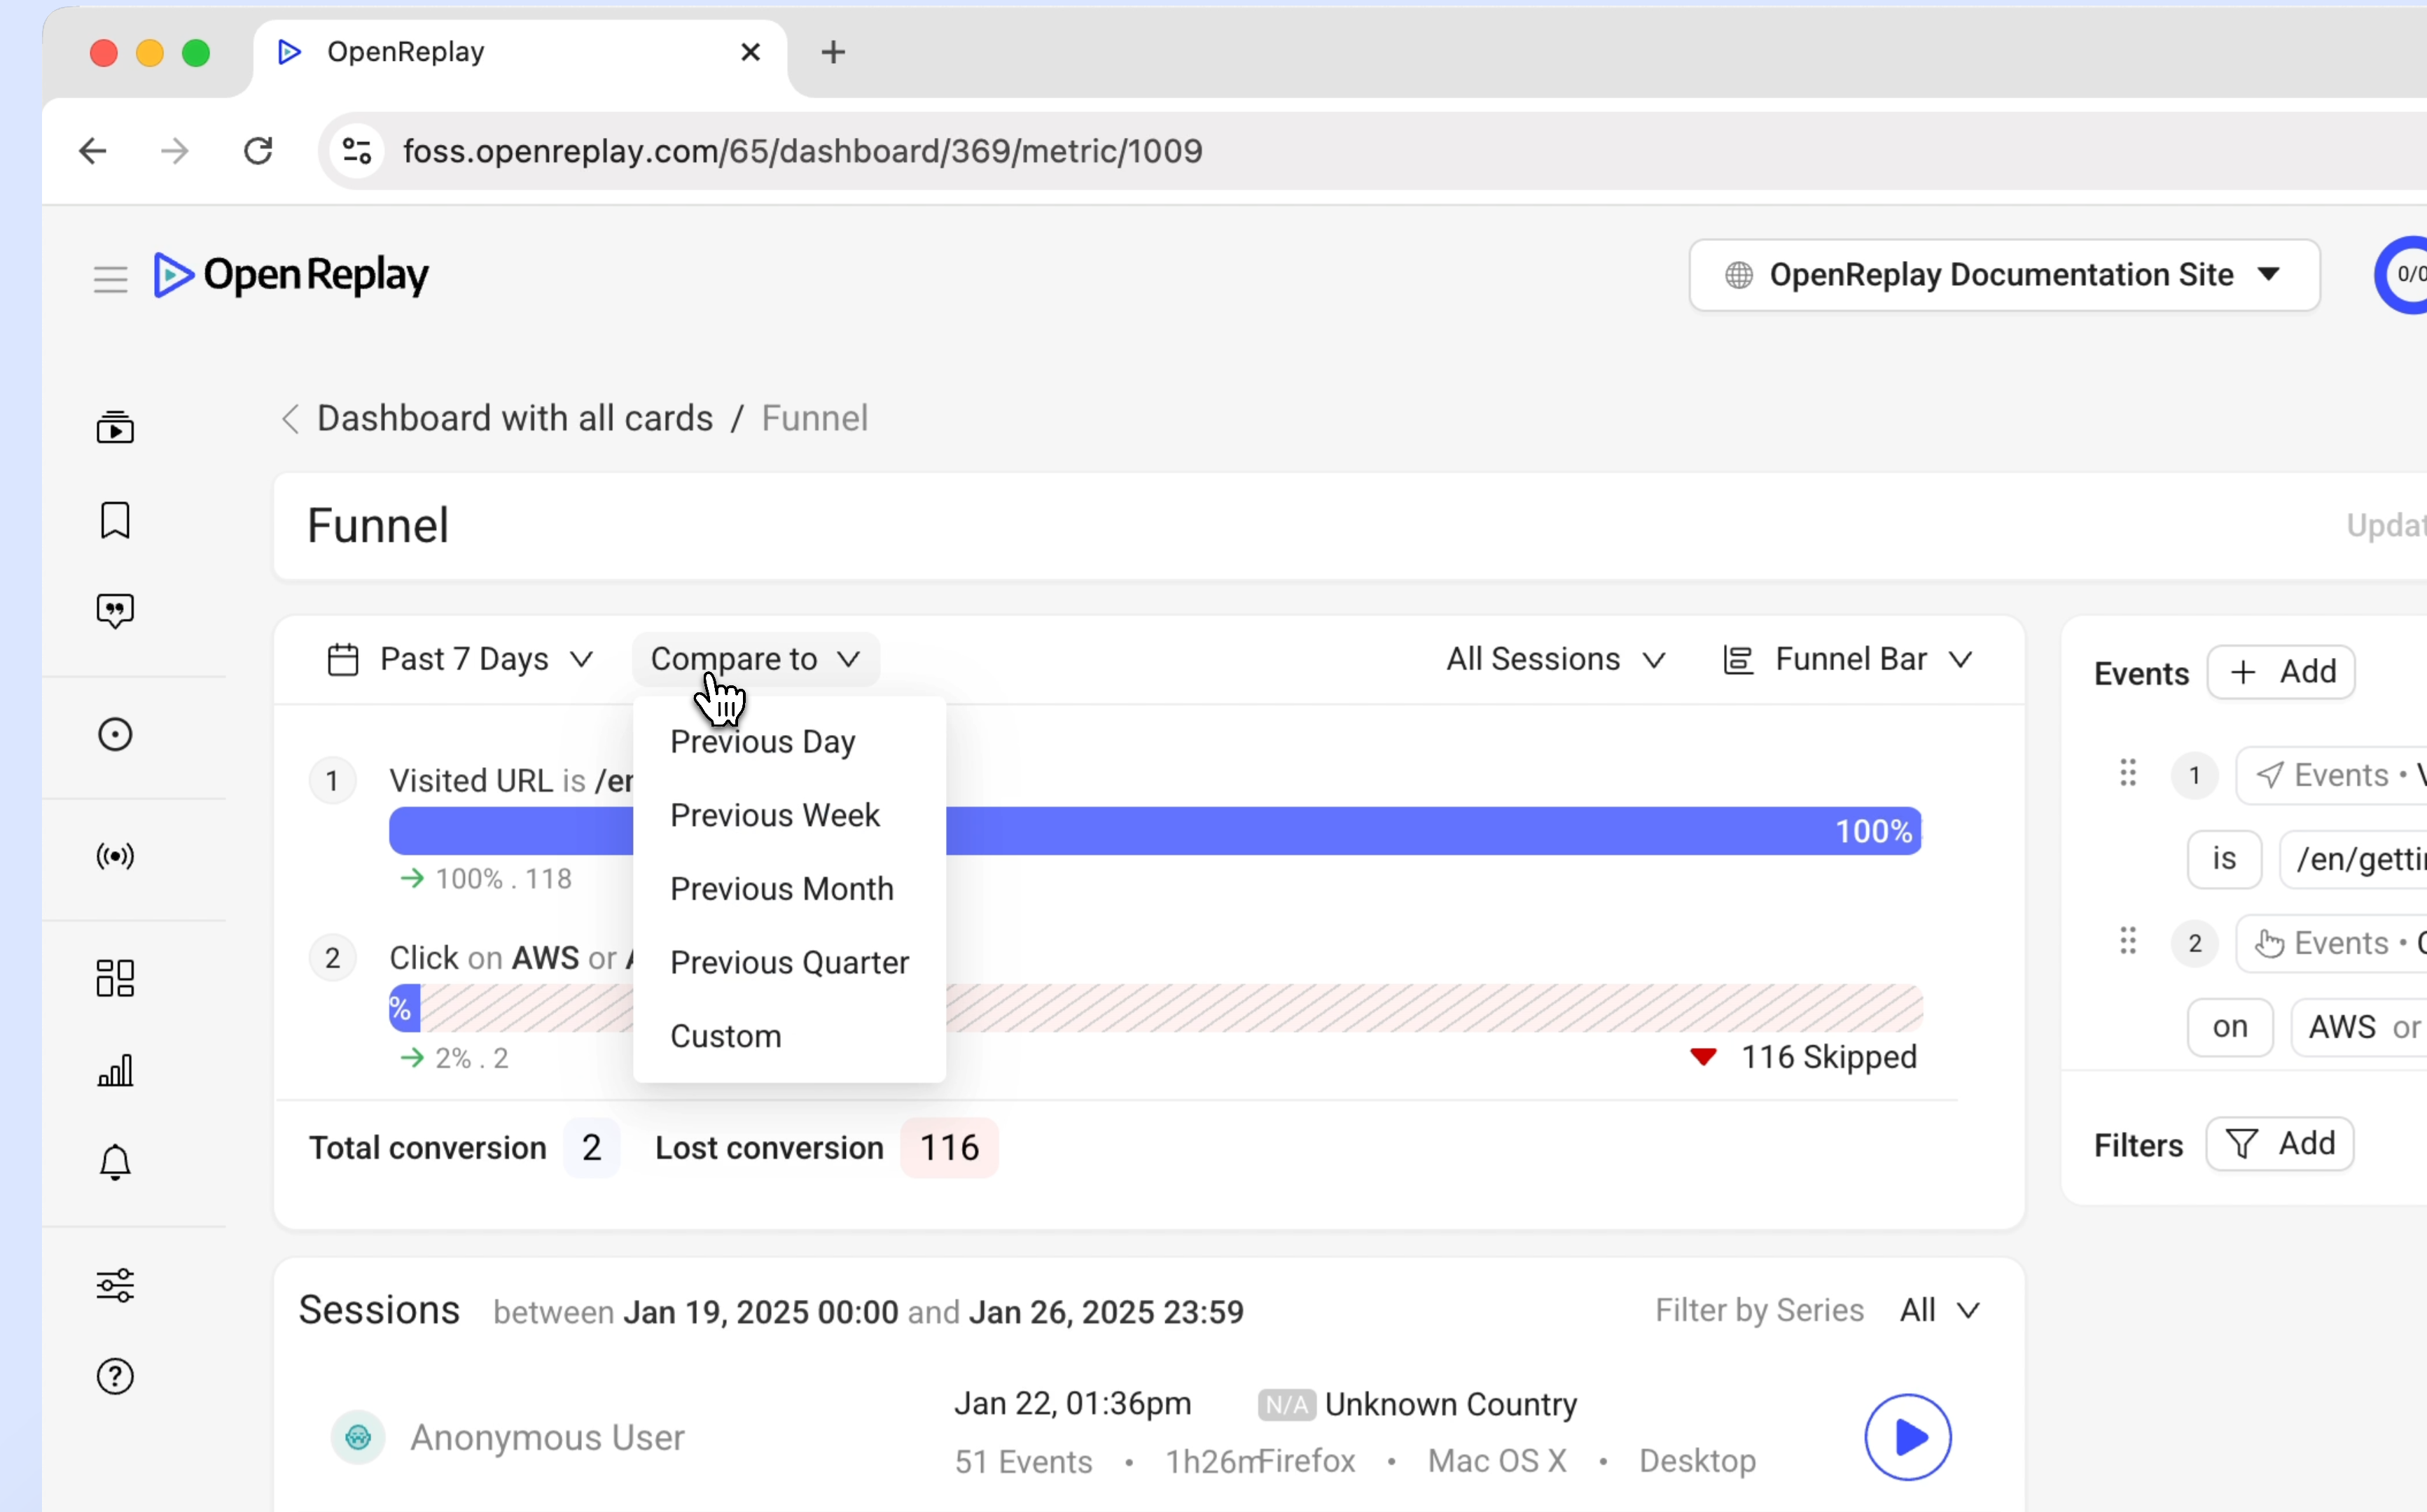
Comparison tools
Section titled Comparison tools- Compare funnel performance to previous periods, such as:
- Previous Day
- Previous Week
- Previous Month
- Previous Quarter
- Custom Ranges
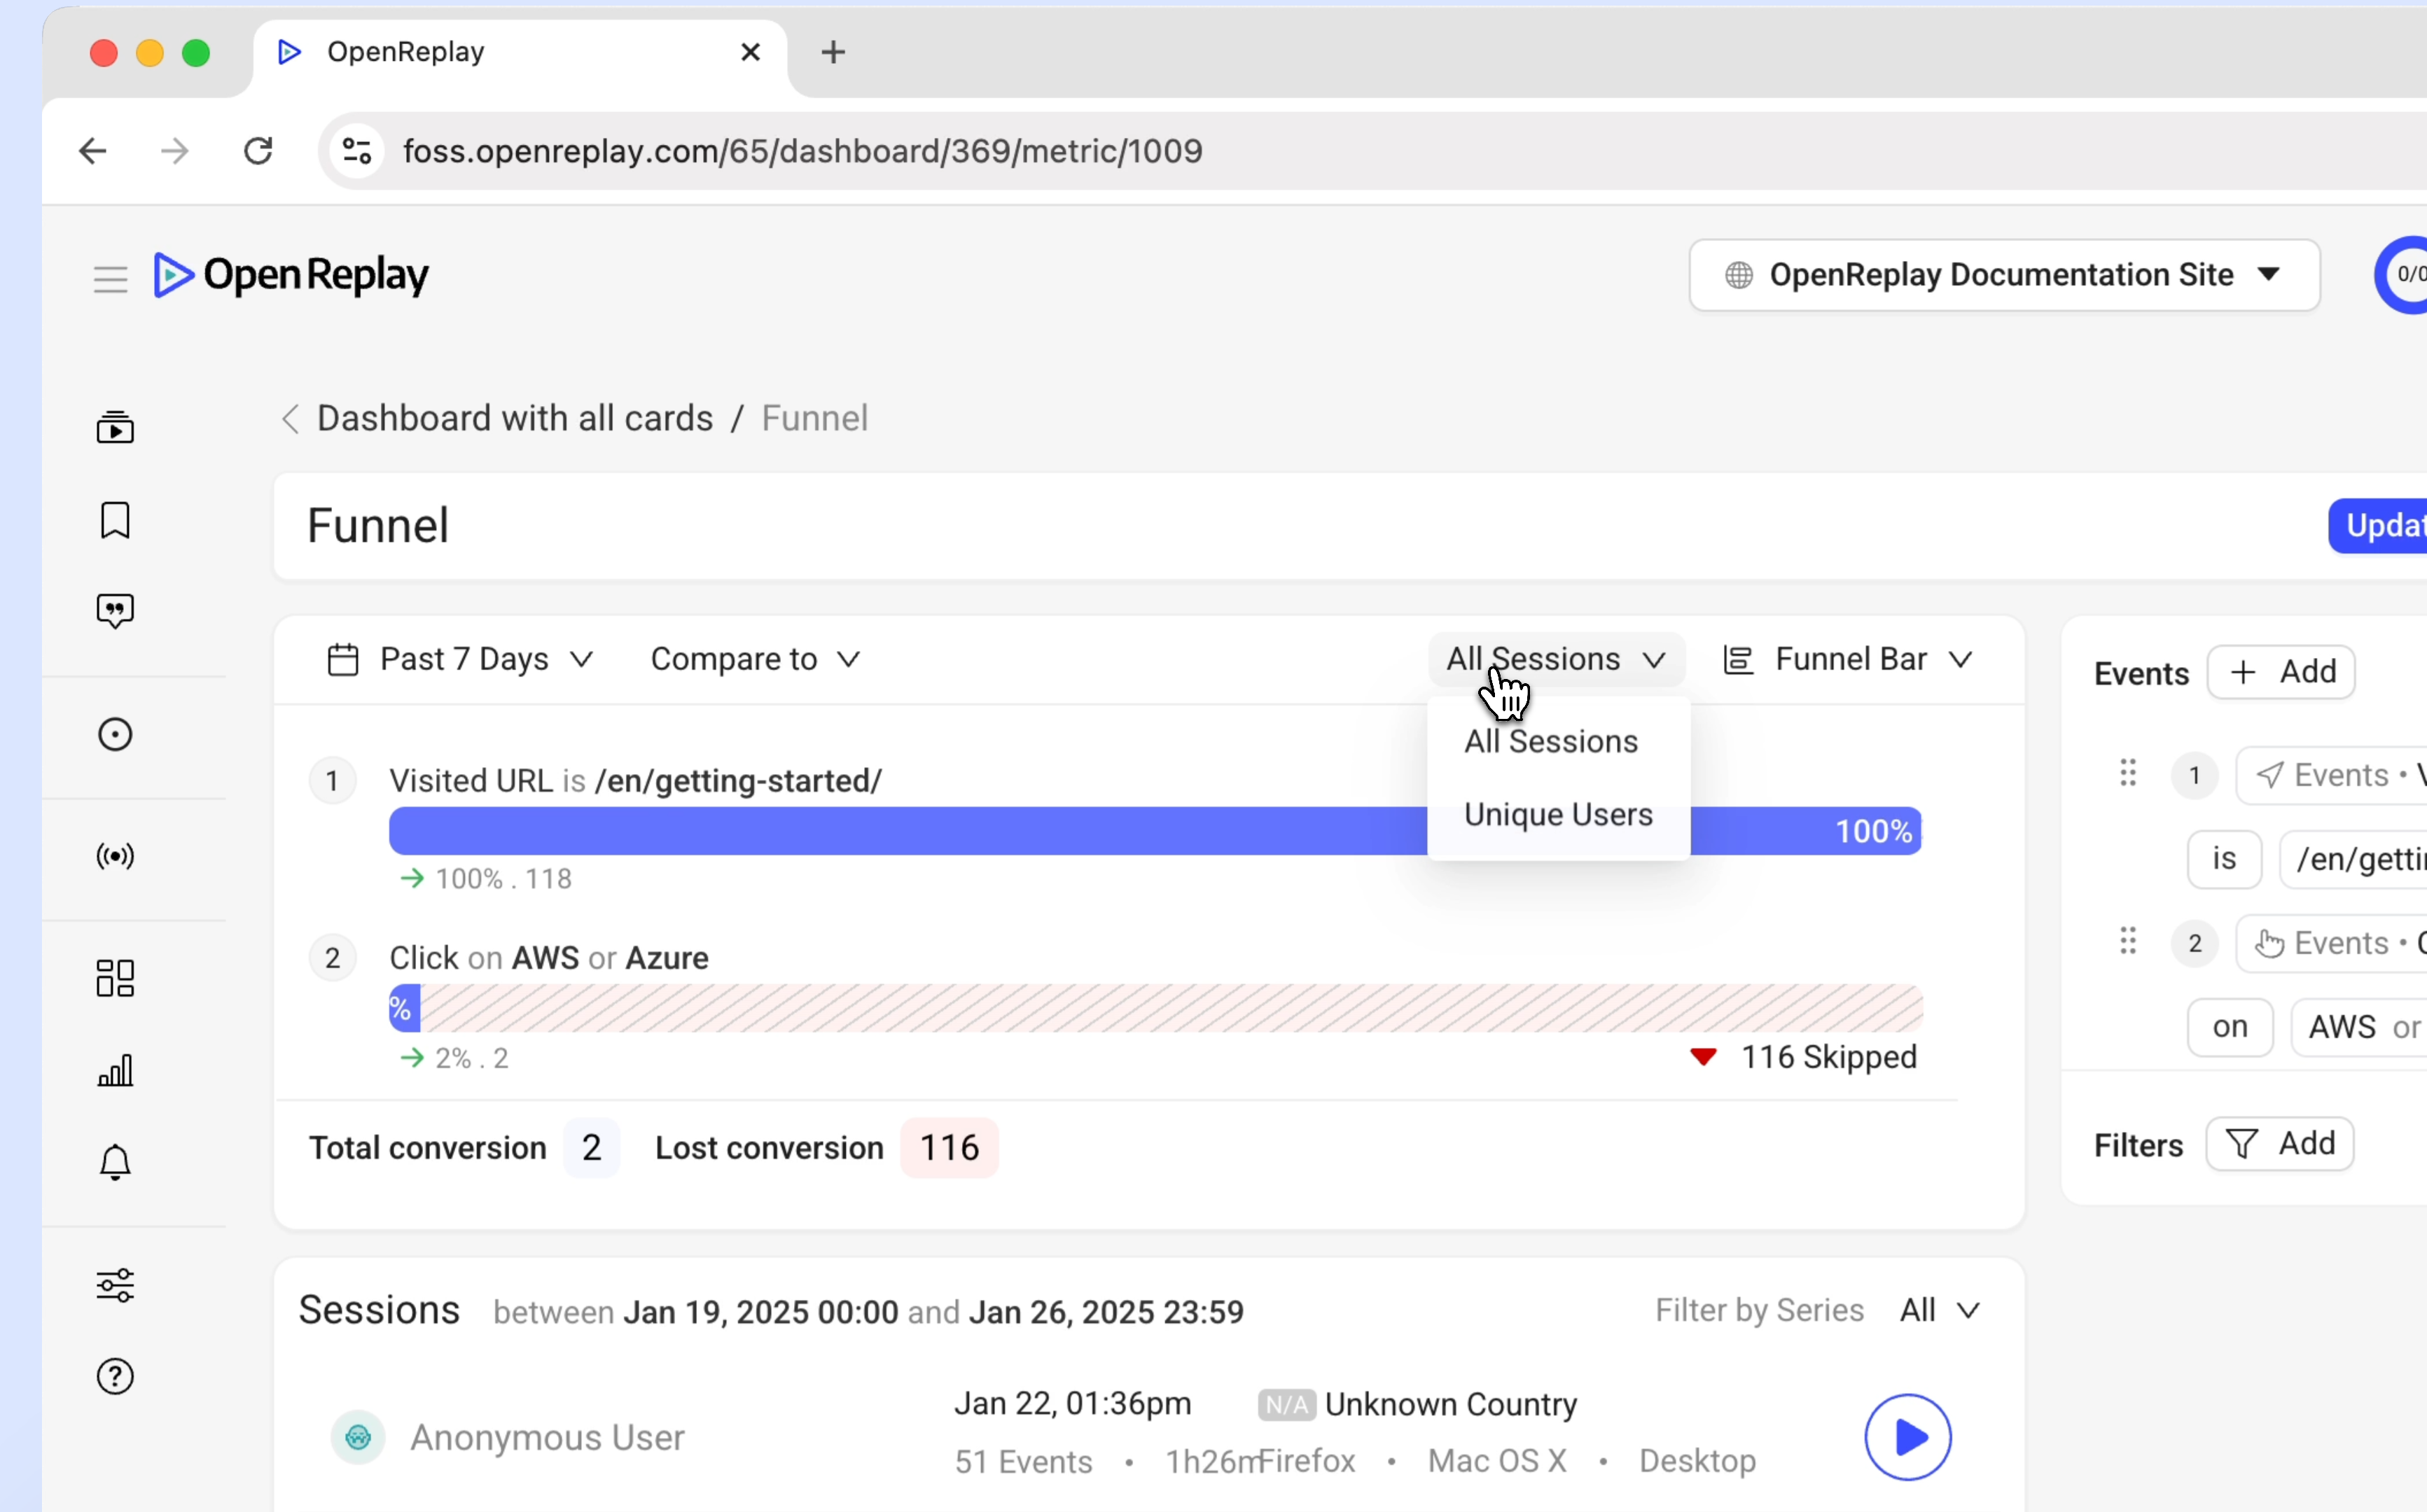
Filter options
Section titled Filter options- Filter by total sessions or unique users.
Advanced capabilities
Section titled Advanced capabilitiesEvents and Filters
Section titled Events and Filters- Combine multiple events such as clicks, text inputs, visited URLs, and tagged elements to define funnel steps.
- Apply filters across all events to focus on user attributes (e.g., User ID, userAnanymousId) or session characteristics (e.g., duration, referrer, country, city, OS, Browser UTM Source..).
Interactive features
Section titled Interactive features- Session Drill downs: Click on the grayed-out sections in the funnel chart to view sessions of users who dropped off at specific steps. Play session replays to identify issues and uncover root causes of drop-offs.
- Conversion metrics: Visualize the total conversion rate, step-by-step conversions, and lost conversions for the entire funnel.
Export options
Section titled Export options- Save funnel visualizations as images for easy sharing with your team or stakeholders.
Make the most out of Funnels
Section titled Make the most out of Funnels- Define clear, actionable funnel steps that align with your business goals.
- Combine filters and events to focus on specific user segments or behaviors.
- Use session replays to add context to drop-offs and uncover root causes.
Have questions?
Section titled Have questions?If you have any issues creating funnels in you project, please contact us on our Slack community and ask our devs directly!