Monitors
Monitors in OpenReplay provides a focused view of critical issues affecting your application’s stability and performance. With preconfigured cards, you can monitor JavaScript errors, network requests, and other key metrics to quickly identify and address problems.
What can you learn from Monitors?
Section titled What can you learn from Monitors?With Monitors, you can answer questions like:
- What JavaScript errors are impacting the user experience?
- Which network requests are the most frequent in your application?
- Are there recurring client-side (4xx) or server-side (5xx) network requests?
- Which network requests are causing the most significant delays?
Setting up your Monitors dashboard
Section titled Setting up your Monitors dashboardCreating a dedicated Monitors dashboard helps you consolidate key metrics in one place, making it easier to stay on top of technical issues. Here’s how:
1. Create a dashboard:
Section titled 1. Create a dashboard:- Navigate to the Dashboards menu.
- Click Add Dashboard and name it Monitors.
2. Add cards:
Section titled 2. Add cards:- Navigate to the Monitors category.
- Add each of the following cards to your dashboard:
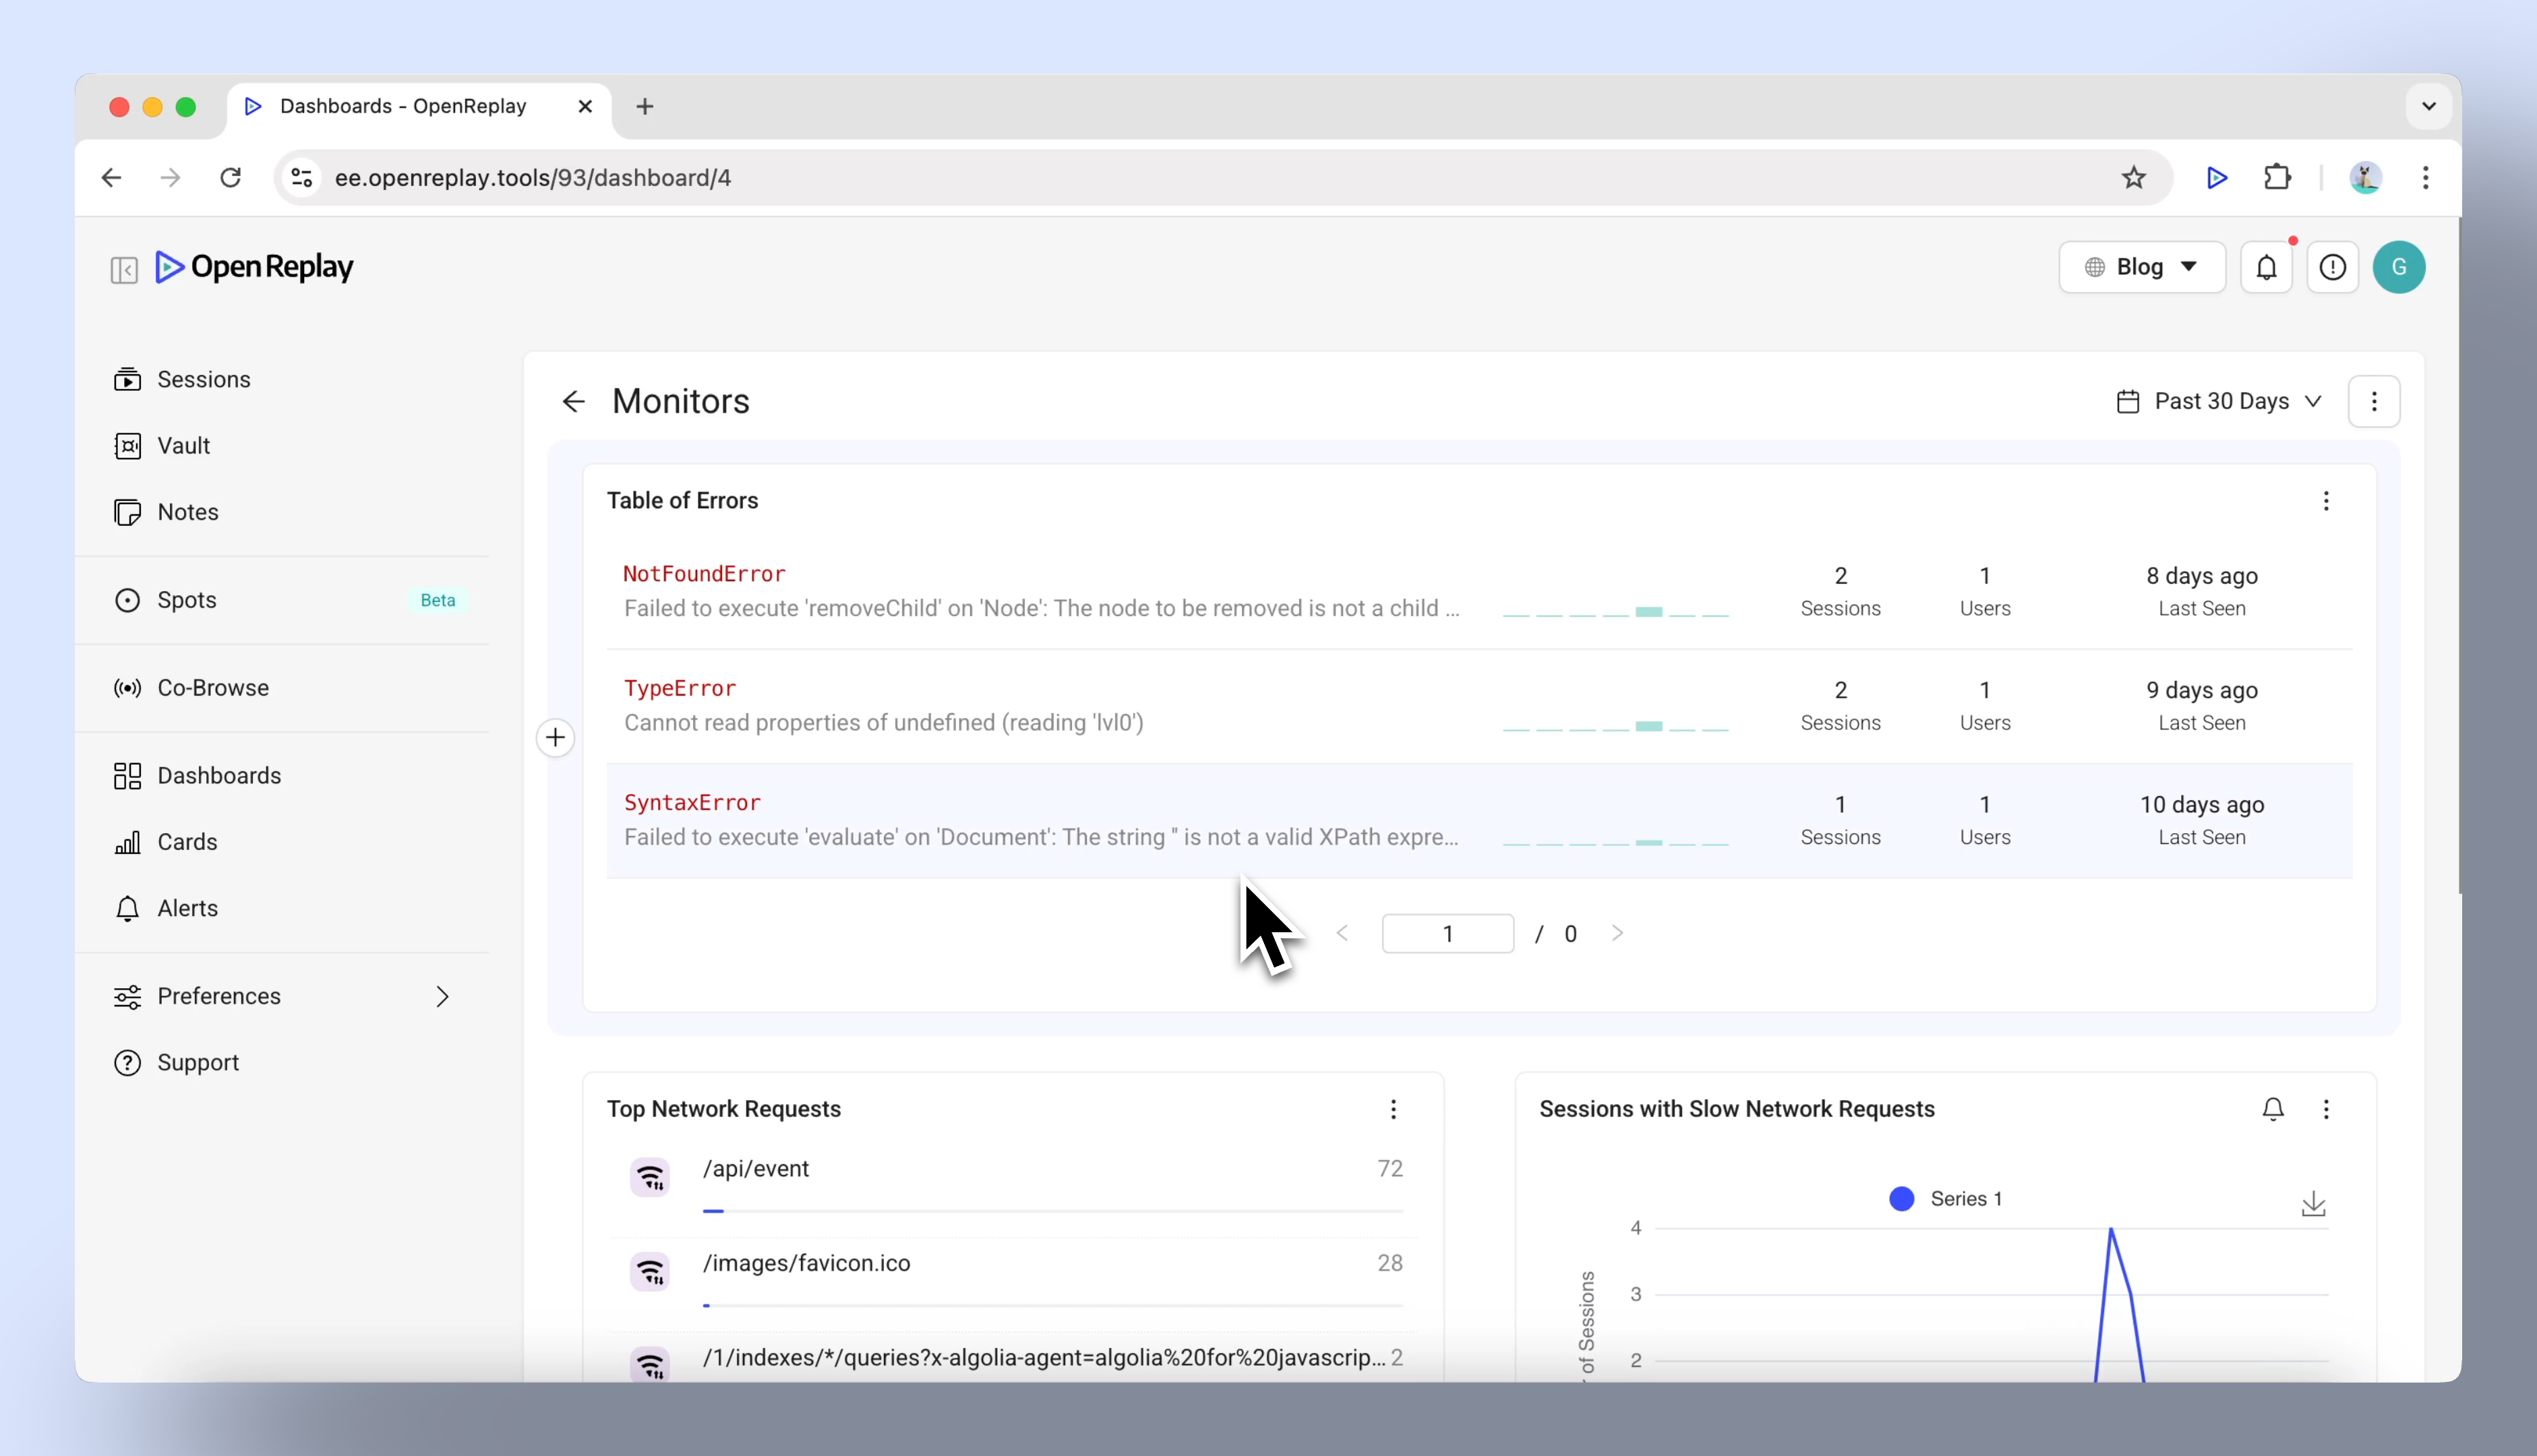
- Table of JS Errors: Monitor JavaScript errors affecting user experience and quickly identify error types, frequencies, and affected users.
- Top Network Requests: View the most frequent network requests and identify high-traffic API endpoints.
- Sessions with 4xx/5xx Requests: Track client-side (4xx) and server-side (5xx) errors
- Sessions with Slow Network Requests: pinpoint network requests causing delays and prioritize fixing slow APIs or overloaded services.
Drill down insights from Monitors
Section titled Drill down insights from MonitorsEach card on the Monitors dashboard is interactive, allowing you to explore issues in greater detail:
Table of JS Errors:
Section titled Table of JS Errors:- Click on an error to view its stack trace.
- Use the ‘Find all sessions with this error’ button to locate all affected sessions.
- Analyze trends with the overview, showing occurrences over the past 24 hours and 30 days.
Sessions with 4xx/5xx and Slow Network Requests:
Section titled Sessions with 4xx/5xx and Slow Network Requests:- Select a point on the chart to view relevant session replays.
- Open the Network tab in the session replay to analyze request details, including duration and statuses.
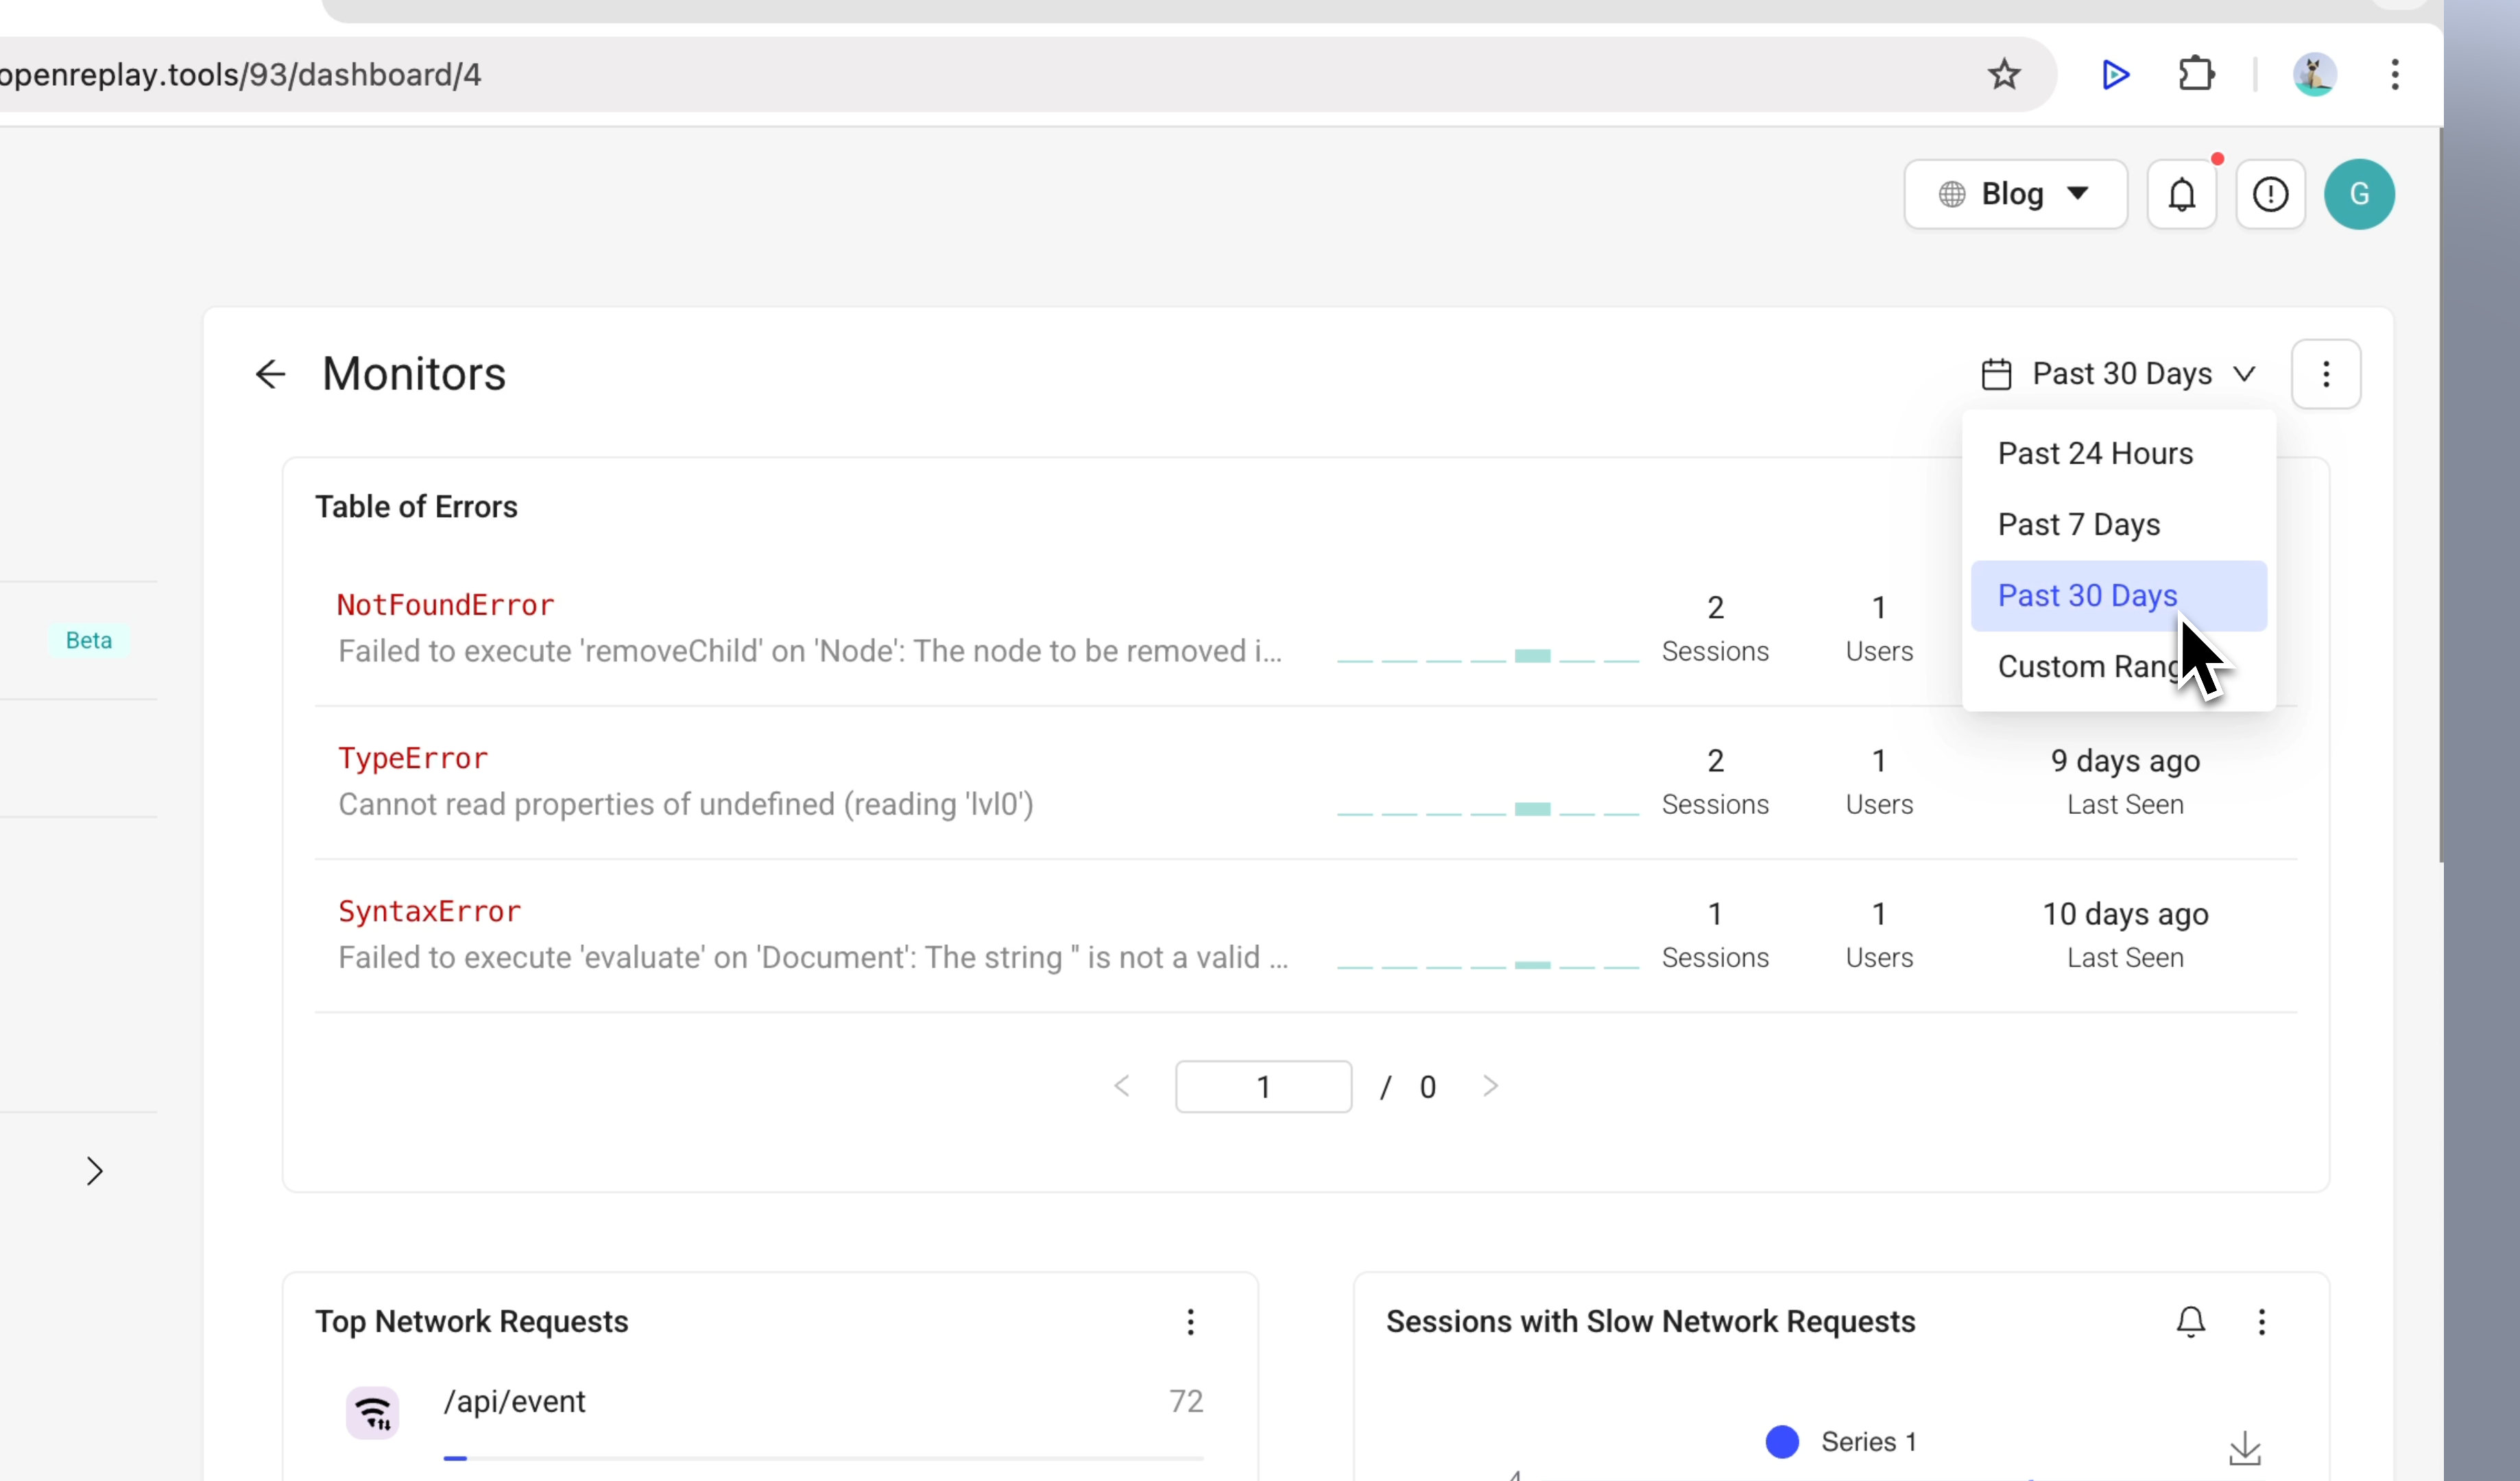
- Adjust the time range for the chart using the dropdown to focus on specific periods.
Top Network Requests:
Section titled Top Network Requests:- Review the most frequent requests in your application.
- Click on a specific request to filter sessions containing it and analyze further.
Adjusting the time range
Section titled Adjusting the time rangeThe default time range for your dashboard is the past 24 hours, but you can change it to better suit your needs:
- Click on the time range dropdown at the top of the dashboard.
- Choose a preset range (e.g., “Last 7 days”) or set a custom time frame.
Alternative card creation
Section titled Alternative card creationIf you prefer, you can create and add cards directly from the Cards View:
- Navigate to Cards View in the Analytics module.
- Create a card for any Monitors metric (e.g., JS errors or slow network requests).
- Add the card to your Monitors dashboard using the Add to Dashboard option.
Make the most out of Monitors
Section titled Make the most out of MonitorsMonitors let you track and address critical issues like JavaScript errors, network performance, and slow requests. Use its interactive features, session replays, and the network tab to dive deep into problems, uncover root causes, and enhance your application’s stability and performance.
Have questions?
Section titled Have questions?If you have any issues creating funnels in you project, please contact us on our Slack community and ask our devs directly!