Web Analytics
Web Analytics in OpenReplay’s Analytics module helps you track high-level metrics about your website or application’s usage. Once your tracker is set up and sessions are being captured, you can monitor data such as top pages, user locations, and traffic sources to better understand overall usage patterns.
What can you learn from Web Analytics?
Section titled What can you learn from Web Analytics?With Web Analytics, you can answer questions like:
- Which pages are the most visited?
- Which browsers and devices are most commonly used?
- Where are your users located?
- What are the top sources driving traffic to your site?
- Who are your most active users?
These insights help you identify patterns, optimize content, and prioritize improvements.
Setting up your Web Analytics dashboard
Section titled Setting up your Web Analytics dashboard- Create a Dashboard:
- Navigate to the Dashboards menu.
- Click Add Dashboard and name it Web Analytics.
- Add Cards:
- Navigate to the Web Analytics category.
- Add each of the following cards to your dashboard:
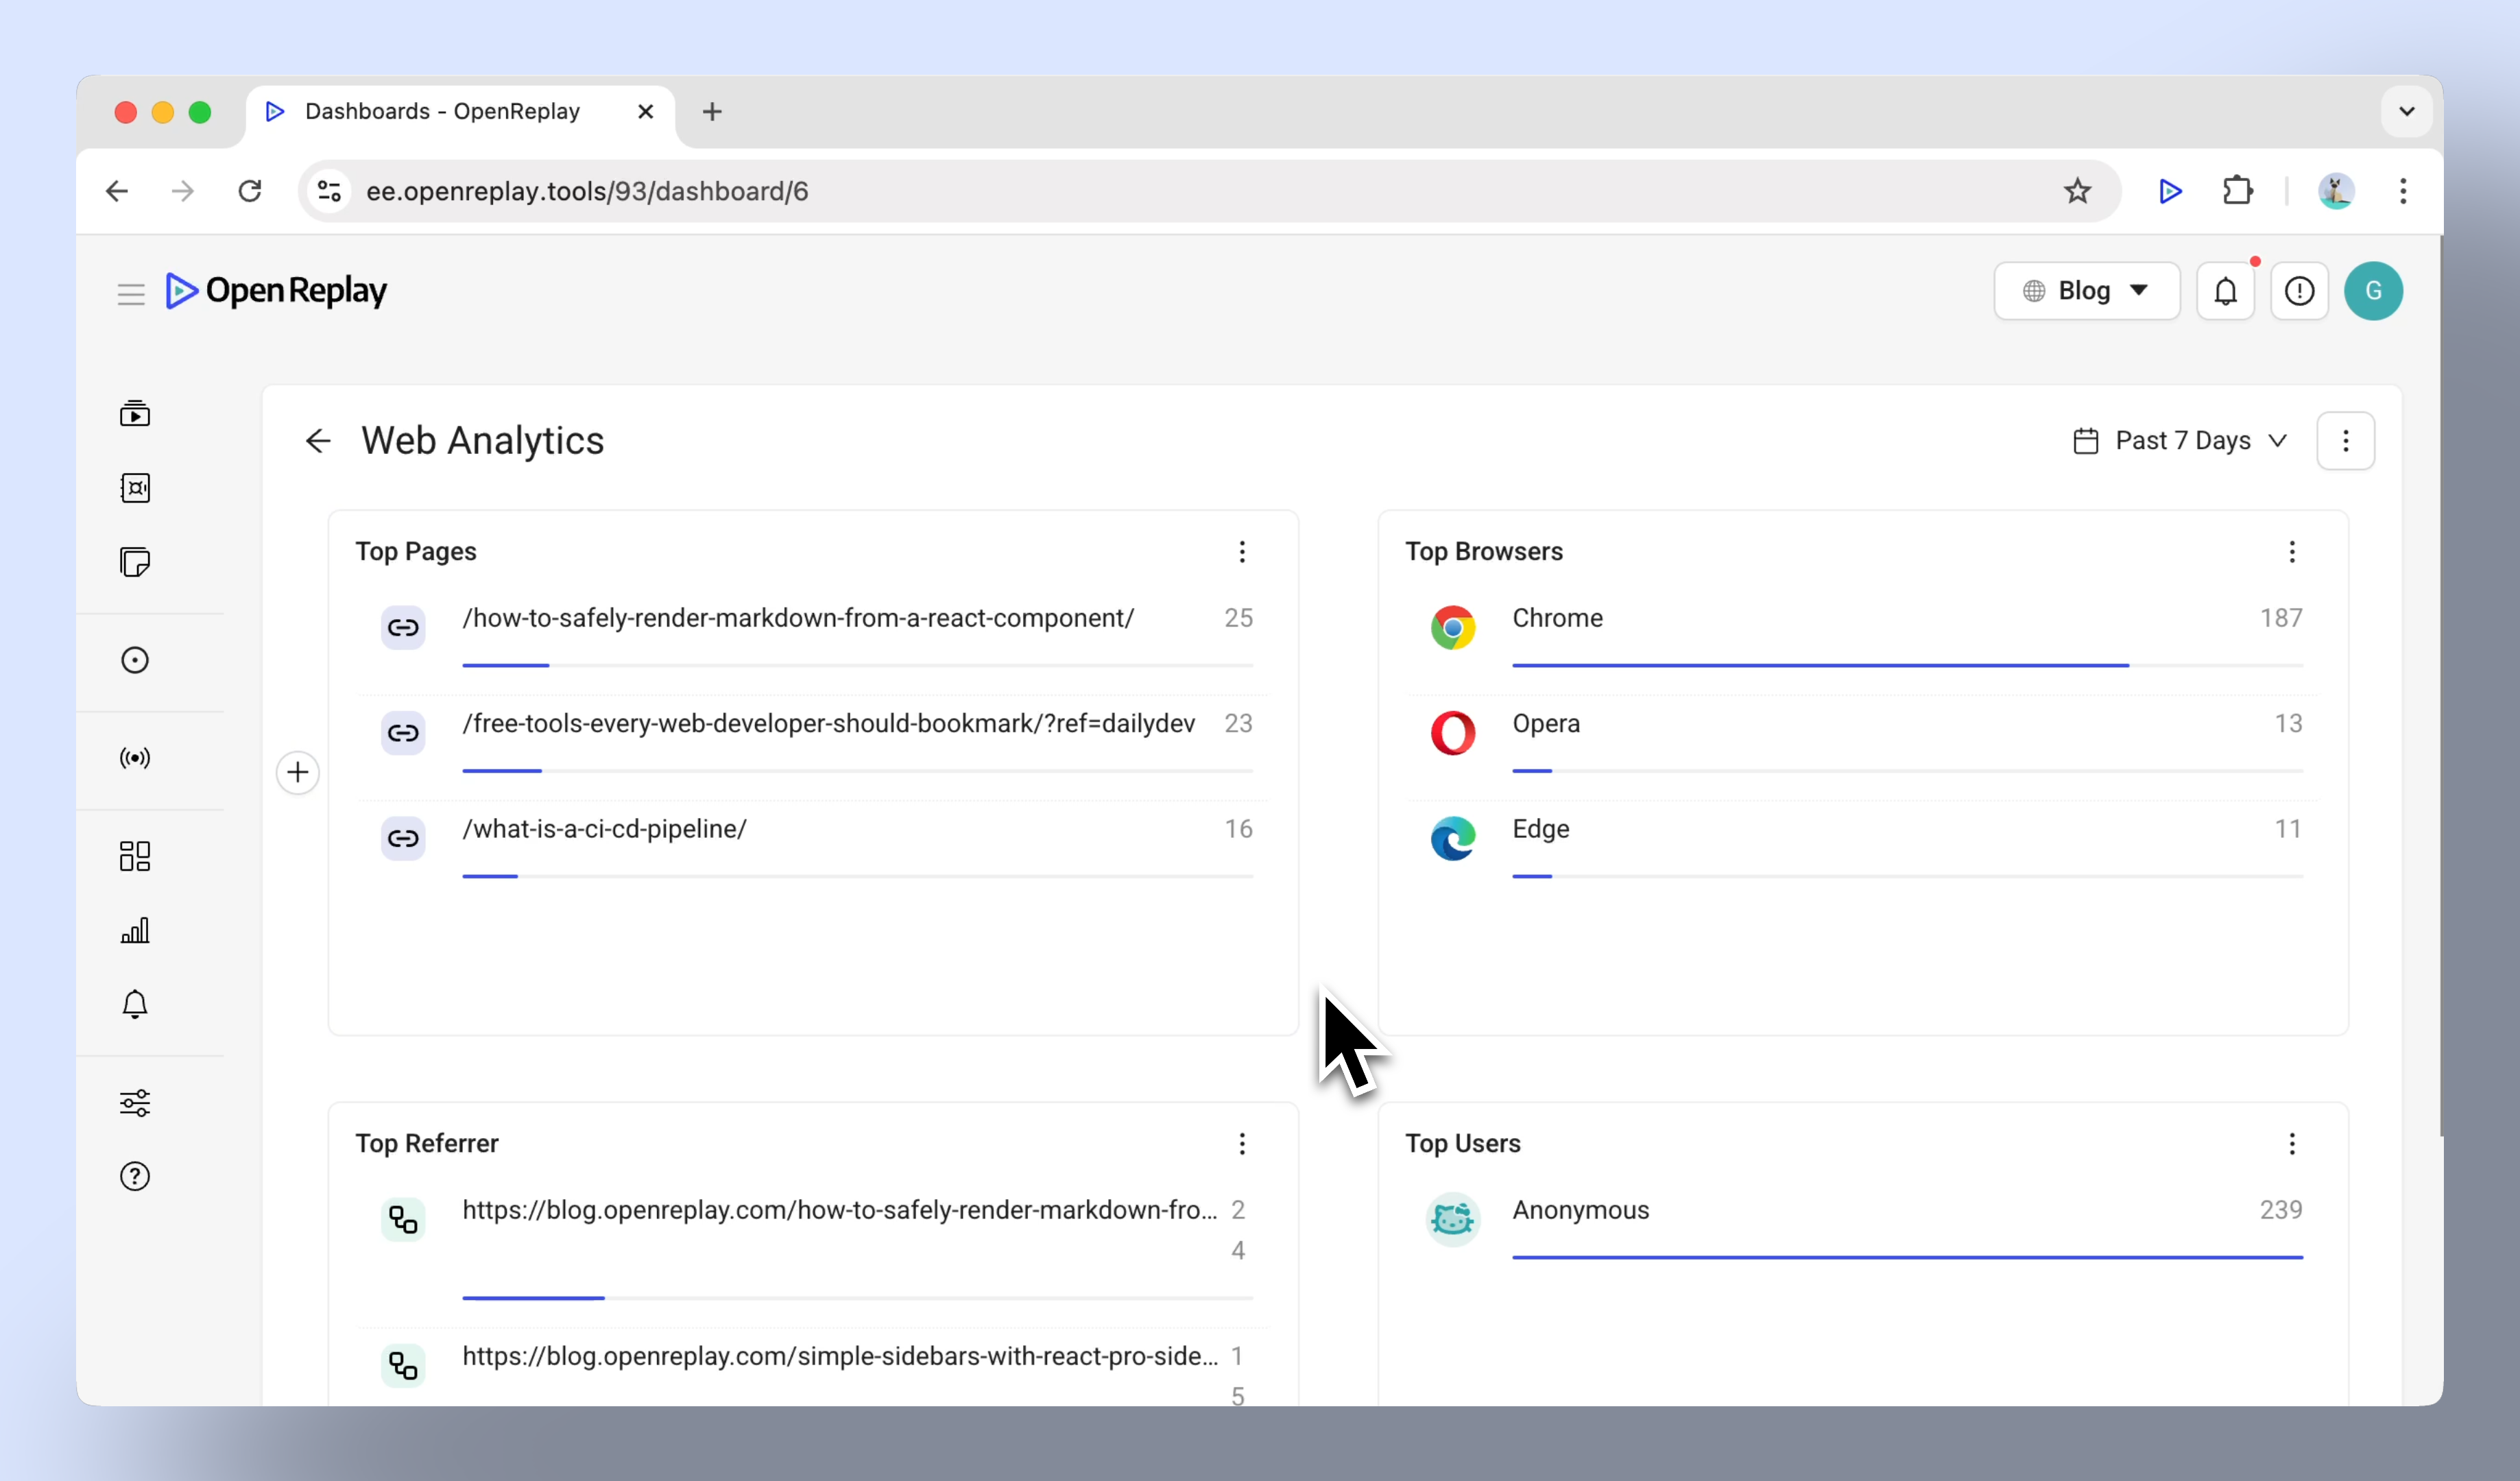
- Top Pages: Discover the most visited pages on your site.
- Top Browsers: Analyze the browsers your visitors are using the most.
- Top Countries:
- Top Referrers: See where your traffic is coming from.
- Top Users: Identify the users with the most interactions. need Identify users
- Top Devices:
Drill Down insights from Web Analytics
Section titled Drill Down insights from Web AnalyticsLet’s take the Top Browsers card as an example:
- Open the Top Browsers card in your dashboard.
- Suppose you notice a significant percentage of users are on Chrome. Click on Chrome to filter sessions specifically for those users.
- Use the Omnisearch component to dive deeper:
- Apply filters like specific events (e.g., clicks) or session attributes to narrow your view further.
- For example, find sessions from Chrome users who encountered a specific error.
By focusing on browser-specific data, you can uncover trends or troubleshoot browser-related issues more effectively.
Adjust the time range
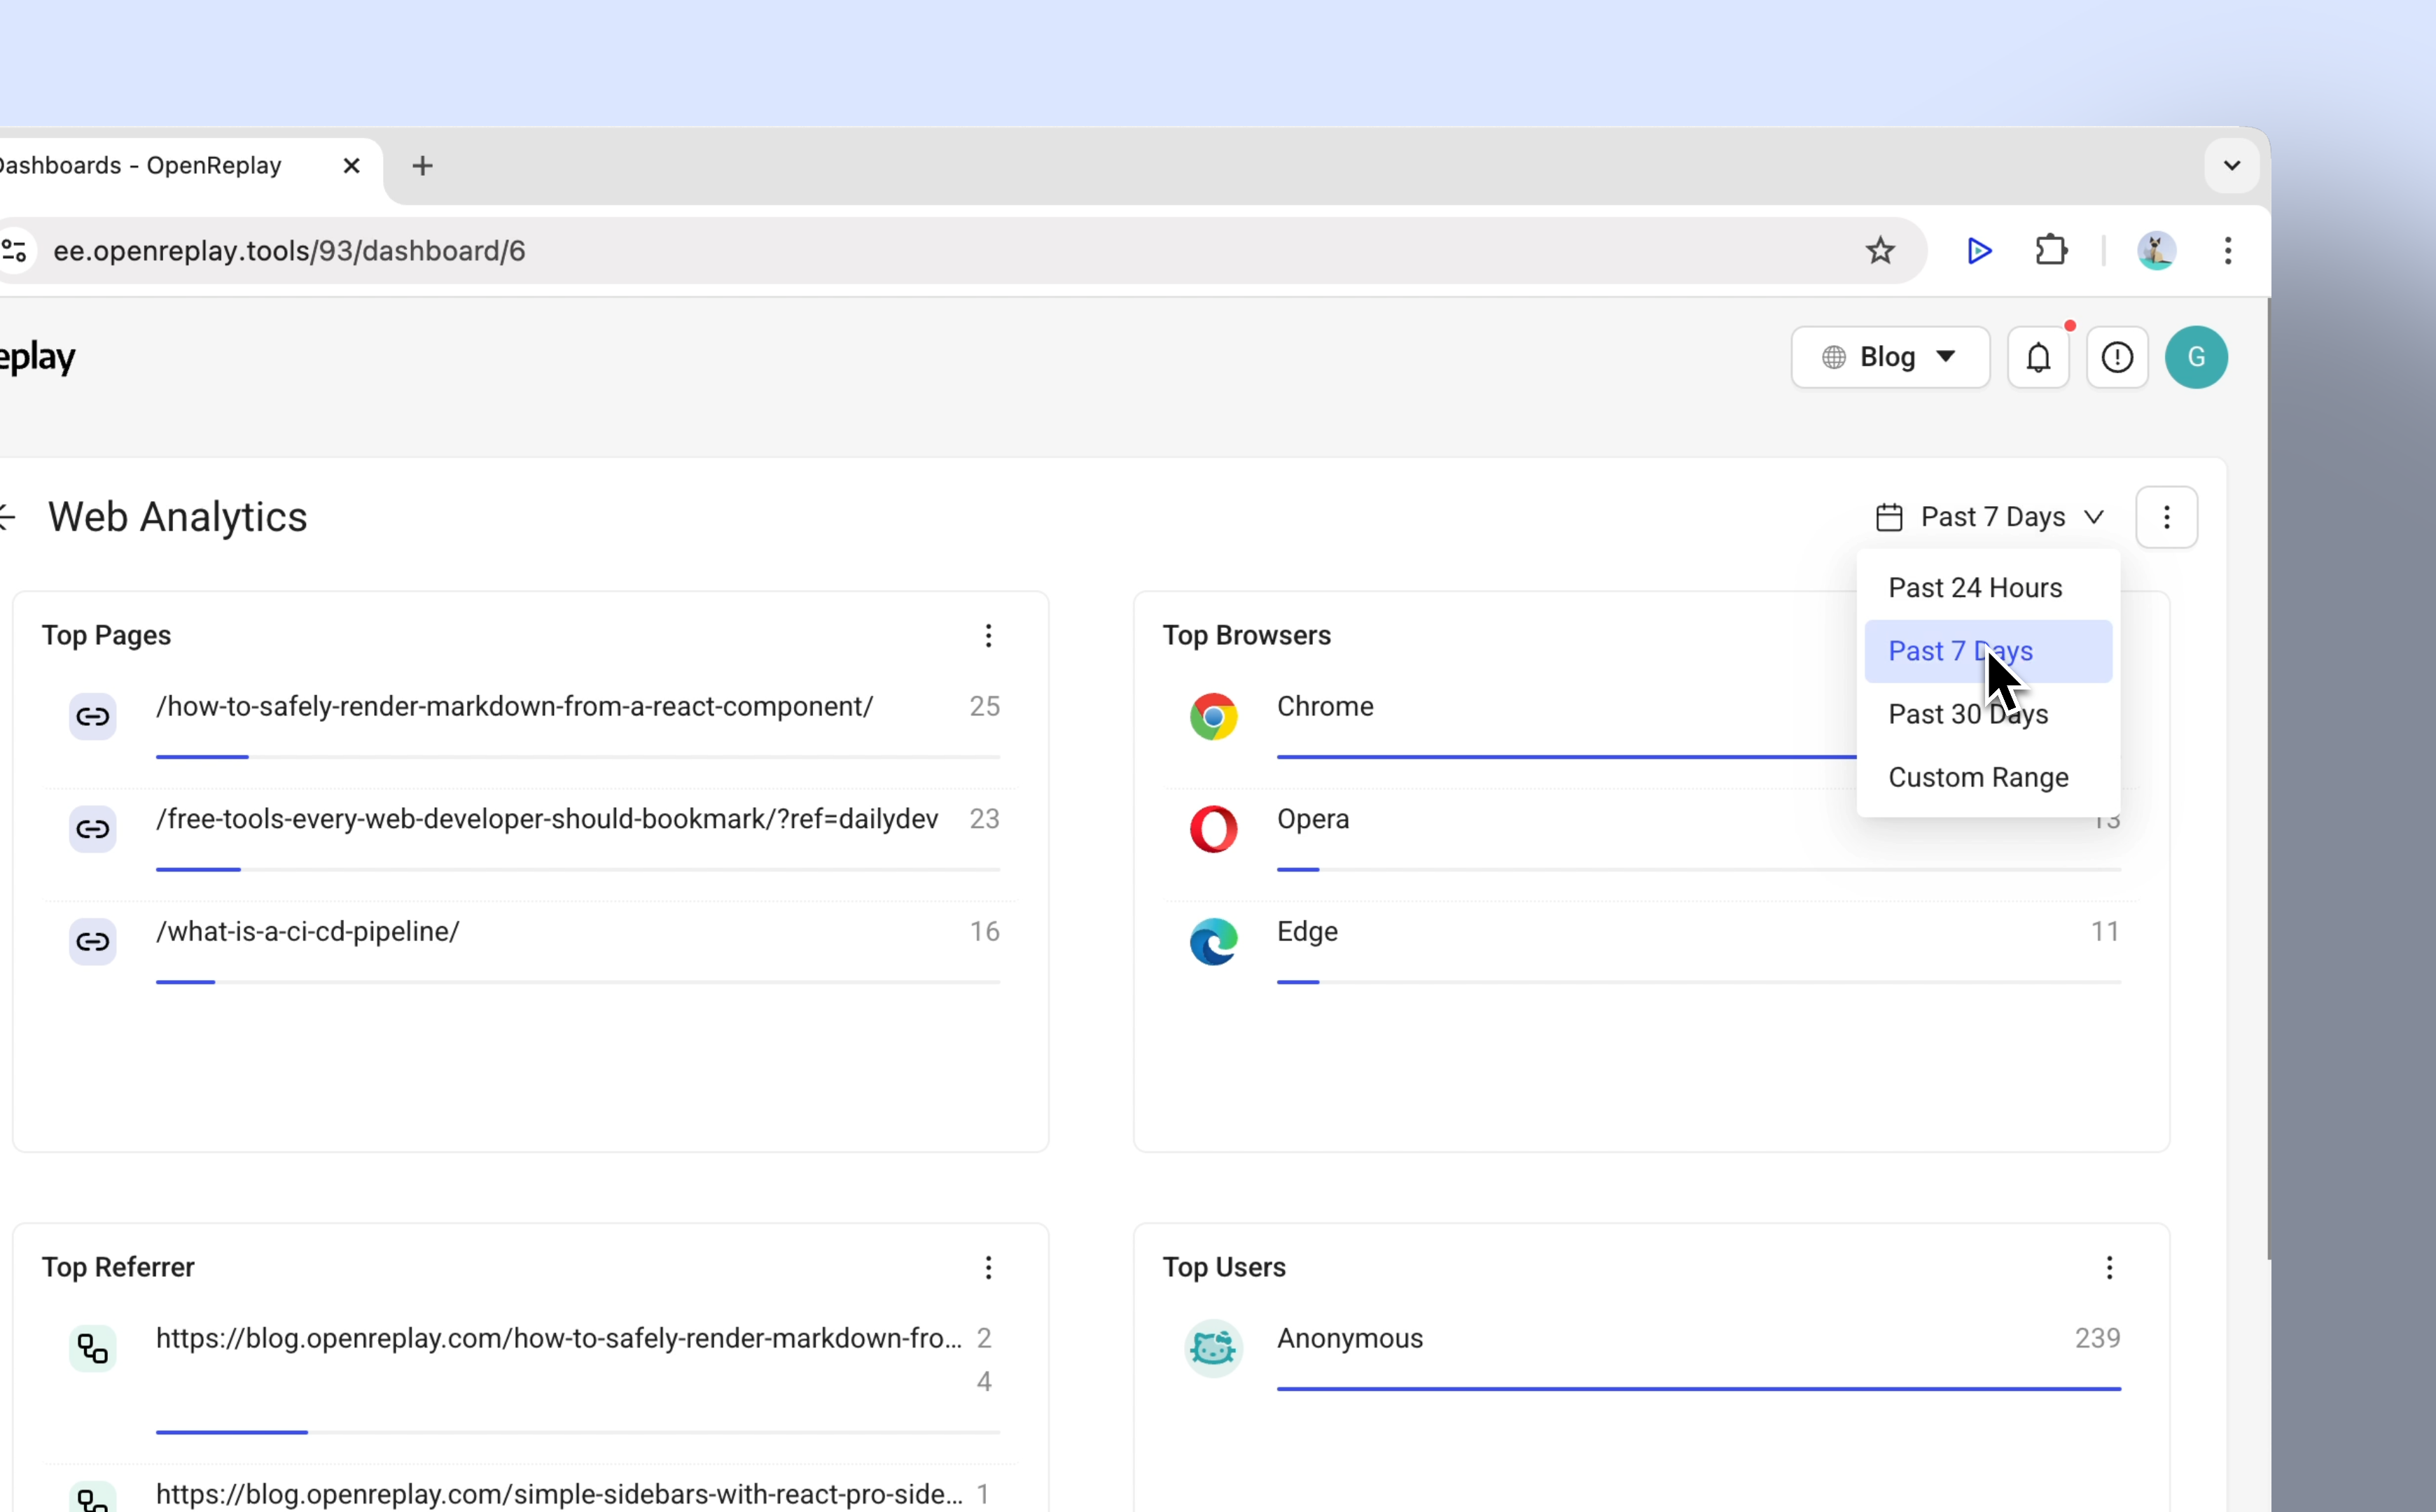
By default, dashboards display data for the last 7 days. To adjust this:
- Click on the time range dropdown (labeled ‘Last 7 days’).
- Choose a preset range (e.g., yesterday) or set a custom time frame.
Alternative card creation
Section titled Alternative card creationYou can also create cards directly from the Cards View:
- Navigate to Cards View in the Analytics module.
- Create a new card for any Web Analytics metric.
- Click Add to Dashboard, and select the Web Analytics dashboard.
Make the most out of Web Analytics
Section titled Make the most out of Web AnalyticsWeb Analytics gives you quick access to high-level metrics that help you track application usage trends. Pair it with tools like session replays and filters to uncover deeper insights and take action.
Have questions?
Section titled Have questions?If you have any issues creating funnels in you project, please contact us on our Slack community and ask our devs directly!