Heatmaps
Heatmaps provide a visual representation of user interactions on your website application, highlighting areas of high activity such as clicks and mouse movements. They help you identify what grabs users’ attention, the buttons or content they completely miss, and areas causing friction.
Heatmaps use cases
Section titled Heatmaps use casesUsing Heatmaps can help you answer many questions like:
- Which elements are users interacting with most on your landing page?
- Are key CTAs being ignored?
- Where do users click on your navigation bar?
- Are users experiencing click rage on specific buttons or elements?
- Which sections of your page hold users’ attention, and which are ignored?
Getting started with Heatmaps
Section titled Getting started with HeatmapsCreate a new Heatmap
Section titled Create a new HeatmapYou can access Heatmaps within the Cards menu, under the category “Product Analytics.” Select “Heatmaps” to start analyzing user interactions.
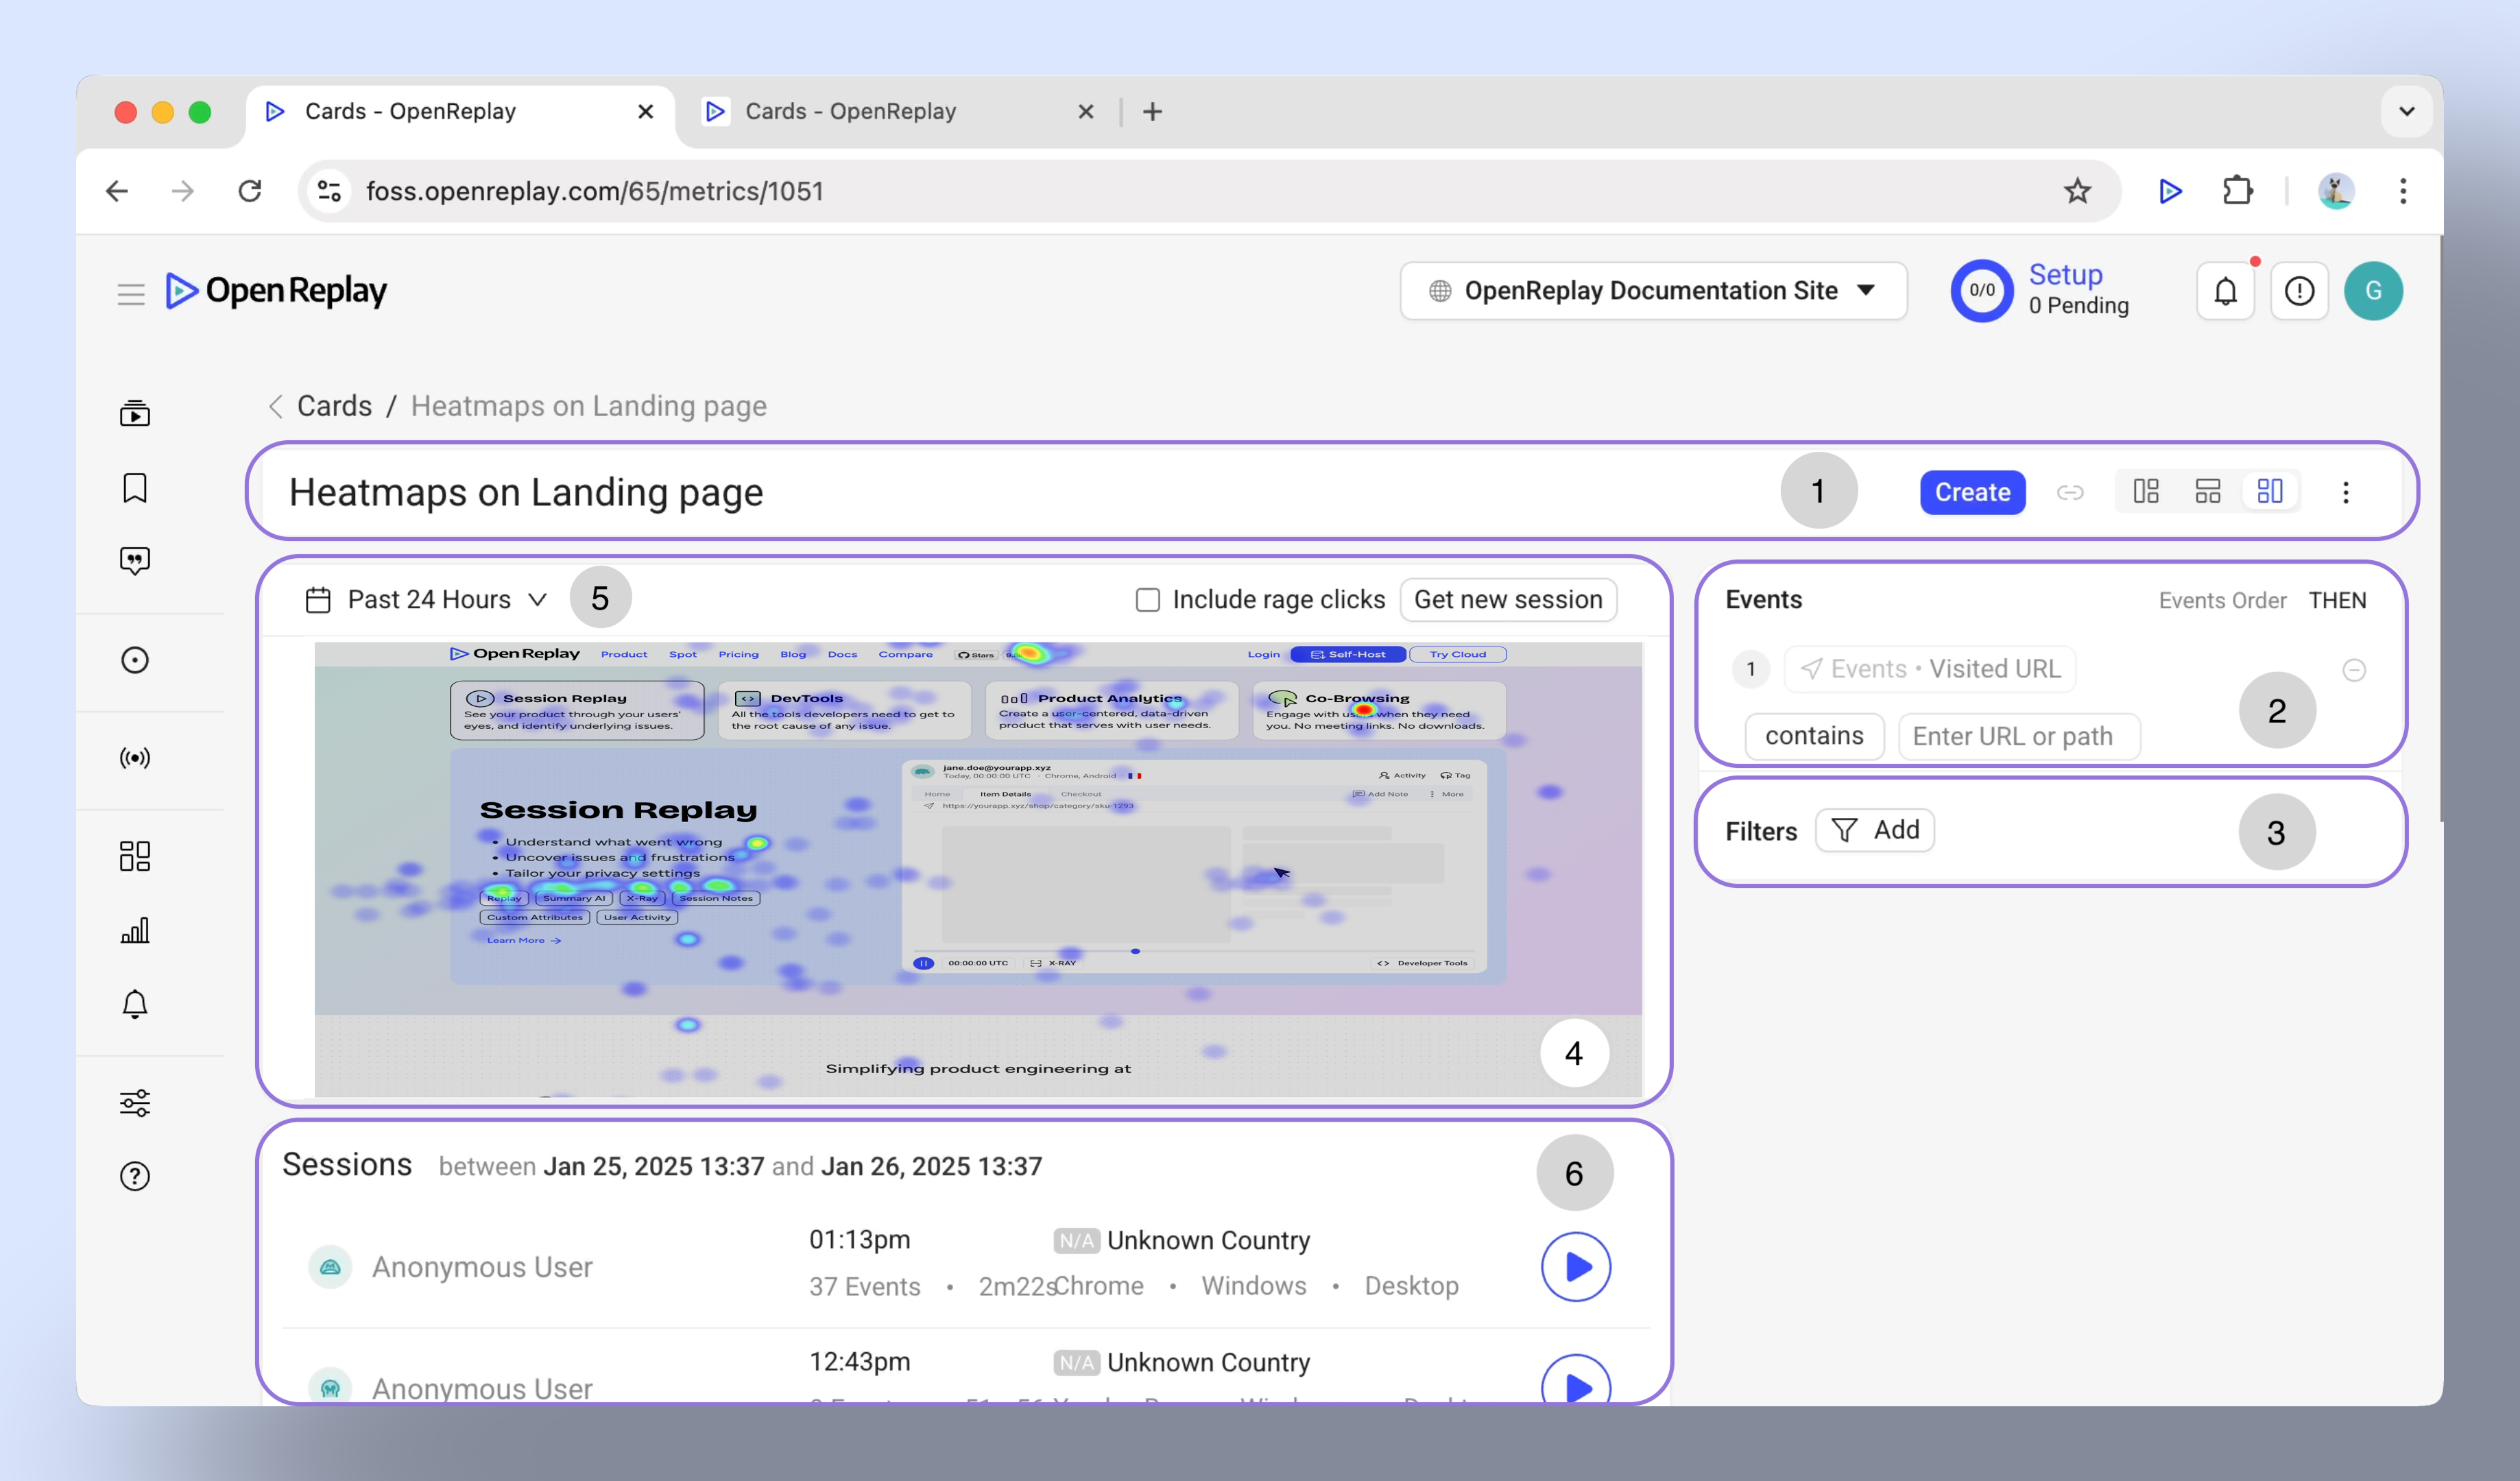
Basic anatomy of Heatmaps card
Section titled Basic anatomy of Heatmaps card- Menu Bar: Change the display layout, rename, delete, or add the heatmap card to a dashboard.
- URL specification: Enter the URL of the page you want to analyze. If you’re unsure, the system provides suggestions based on your site’s most popular pages.
- Filters: Apply filters such as user attributes or session characteristics to narrow down the data.
- Heatmap area: View highlights of mouse clicks, and click rage highlights. Use the “Get New Session” button to refresh the screenshot.
- Time range: Adjust the analysis period to Past 24 Hours, Past 7 Days, or a custom range.
- Sessions list: See sessions for detailed replays.
Setting Up a Heatmap
Section titled Setting Up a HeatmapEnter the URL of your Heatmap page
Section titled Enter the URL of your Heatmap pageUse the URL field to specify the page you want to analyze. Options include:
- URL contains: Displays data for all URLs that include the entered text (case-sensitive).
- URL starts With: Displays results for all URLs beginning with the entered text.
- URL ends With: Displays results for all URLs ending with the entered texts.
Filter your Heatmap data
Section titled Filter your Heatmap dataFilters help you refine the data for more actionable insights. Available filters include:
- User attributes (e.g., User ID, userAnanymousId ).
- Session characteristics (e.g., country, city, OS, Browser UTM Source,… ).
- Issues (e.g., click rage, dead click, bad request,… ).
Make the most out of Heatmaps
Section titled Make the most out of Heatmaps- Focus on high-traffic pages for the most actionable insights.
- Use filters to segment data by user attributes or session parameters.
- Combine heatmap insights with session replays to uncover the “why” behind user actions.
Have questions?
Section titled Have questions?If you have any issues creating funnels in you project, please contact us on our Slack community and ask our devs directly!