How to use Spot
Video Tutorial
Watch how to get started with Spot
Watch this quick video to start using Spot and report bugs faster than ever!
What is Spot?
Section titled What is Spot?Spot is a Chrome extension that makes bug reporting blazingly fast and simple.
With Spot, you can easily record bugs right from your browser and share them instantly with your team. The end-result is a complete, ready-to-share bug report in video format, including user actions, console logs and errors, network payloads, and user agent data. In short, you get everything you need to report a bug faster than ever, and everything your team needs to fix it just as quickly.
What you need to know
Section titled What you need to know- Spot comes with every OpenReplay plan from our open-source to our enterprise offerings.
- Spot is a Chrome extension that also works on any Chromium-based browser, including Microsoft Edge, Brave and Arc.
How to install and set up the Spot Chrome extension
Section titled How to install and set up the Spot Chrome extension1. Install the extension
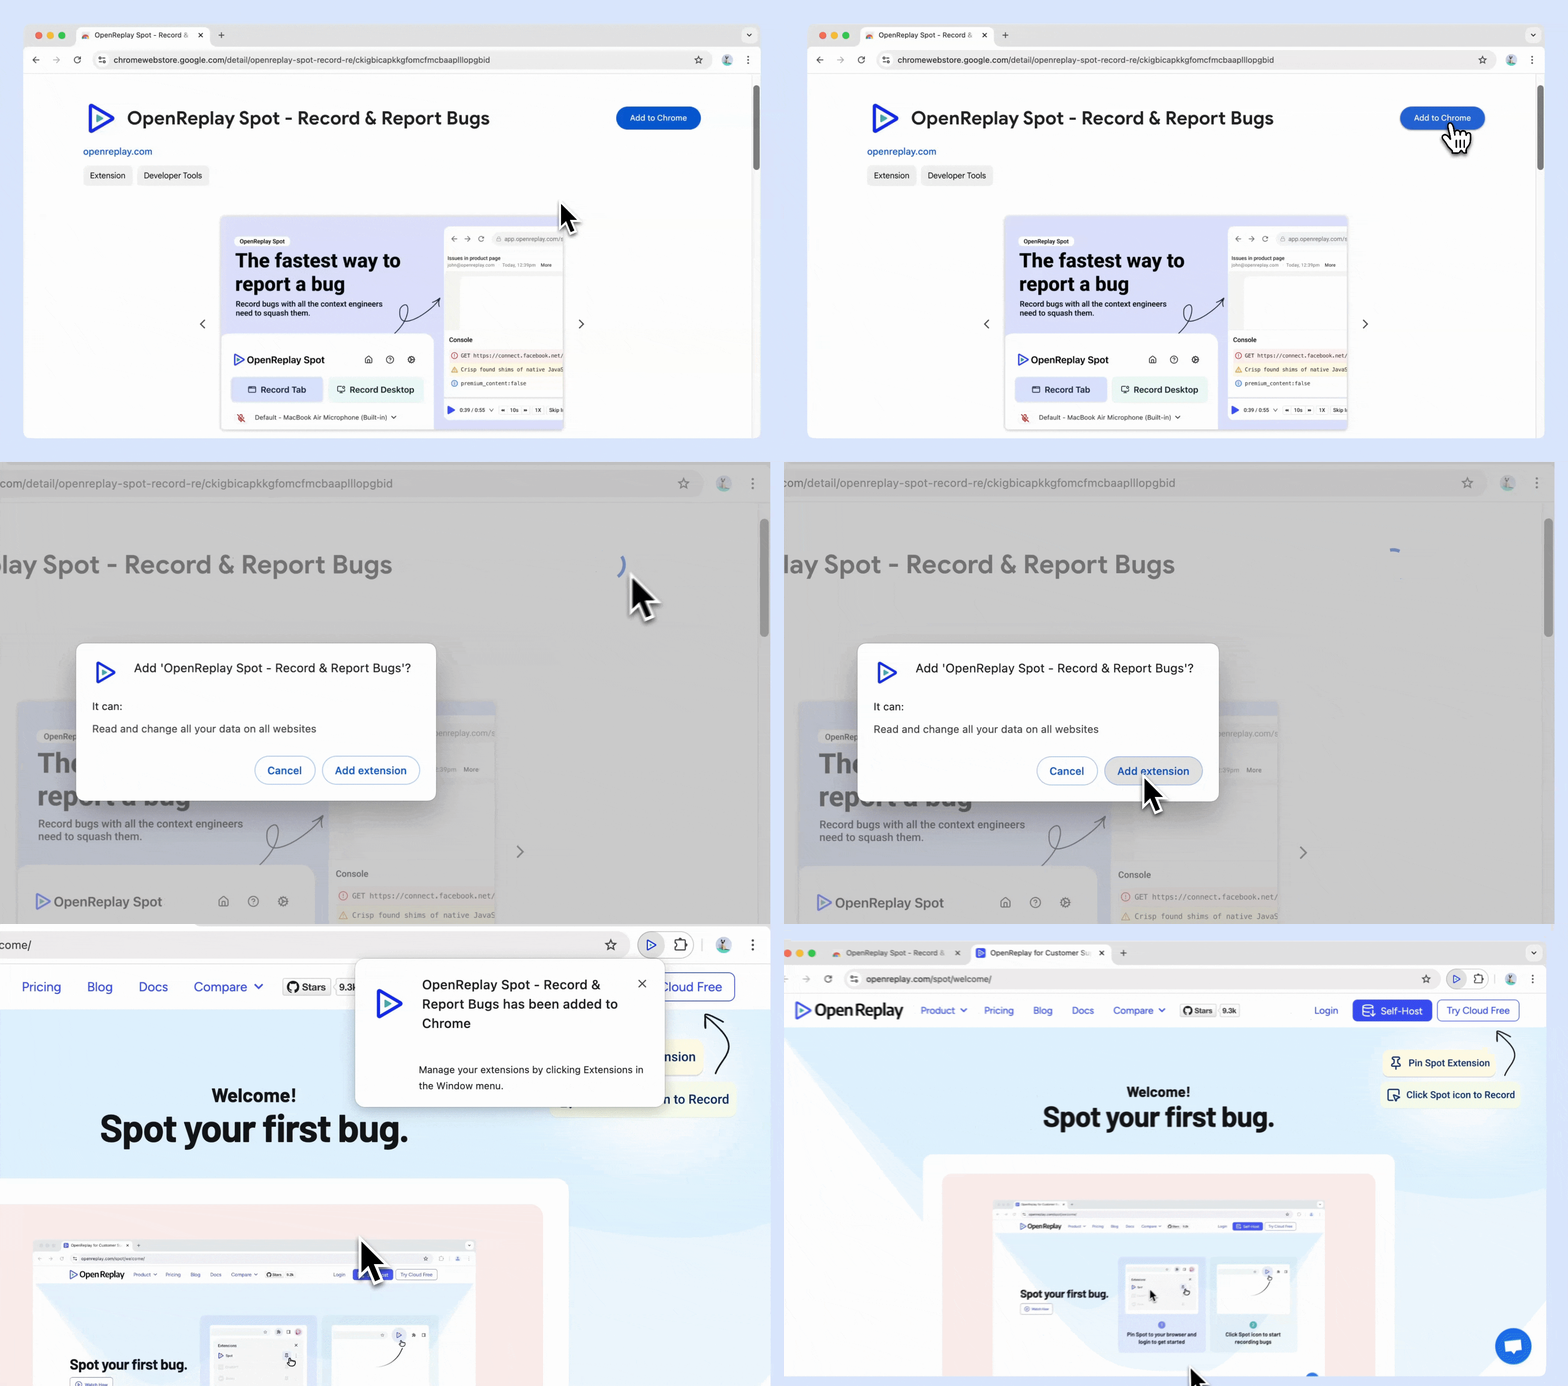
Section titled 1. Install the extensionInstalling the Spot Chrome extension is quick and easy:
- Go to the Spot extension page on the Chrome Web Store and click Add to Chrome.
- Pin Spot to your Chrome toolbar for easy future access.
2. Set up your OpenReplay Spot account
Section titled 2. Set up your OpenReplay Spot accountBefore you start using Spot, you need to either log in to your existing OpenReplay account or create a new one:
-
OpenReplay cloud
Section titled OpenReplay cloud- New users:
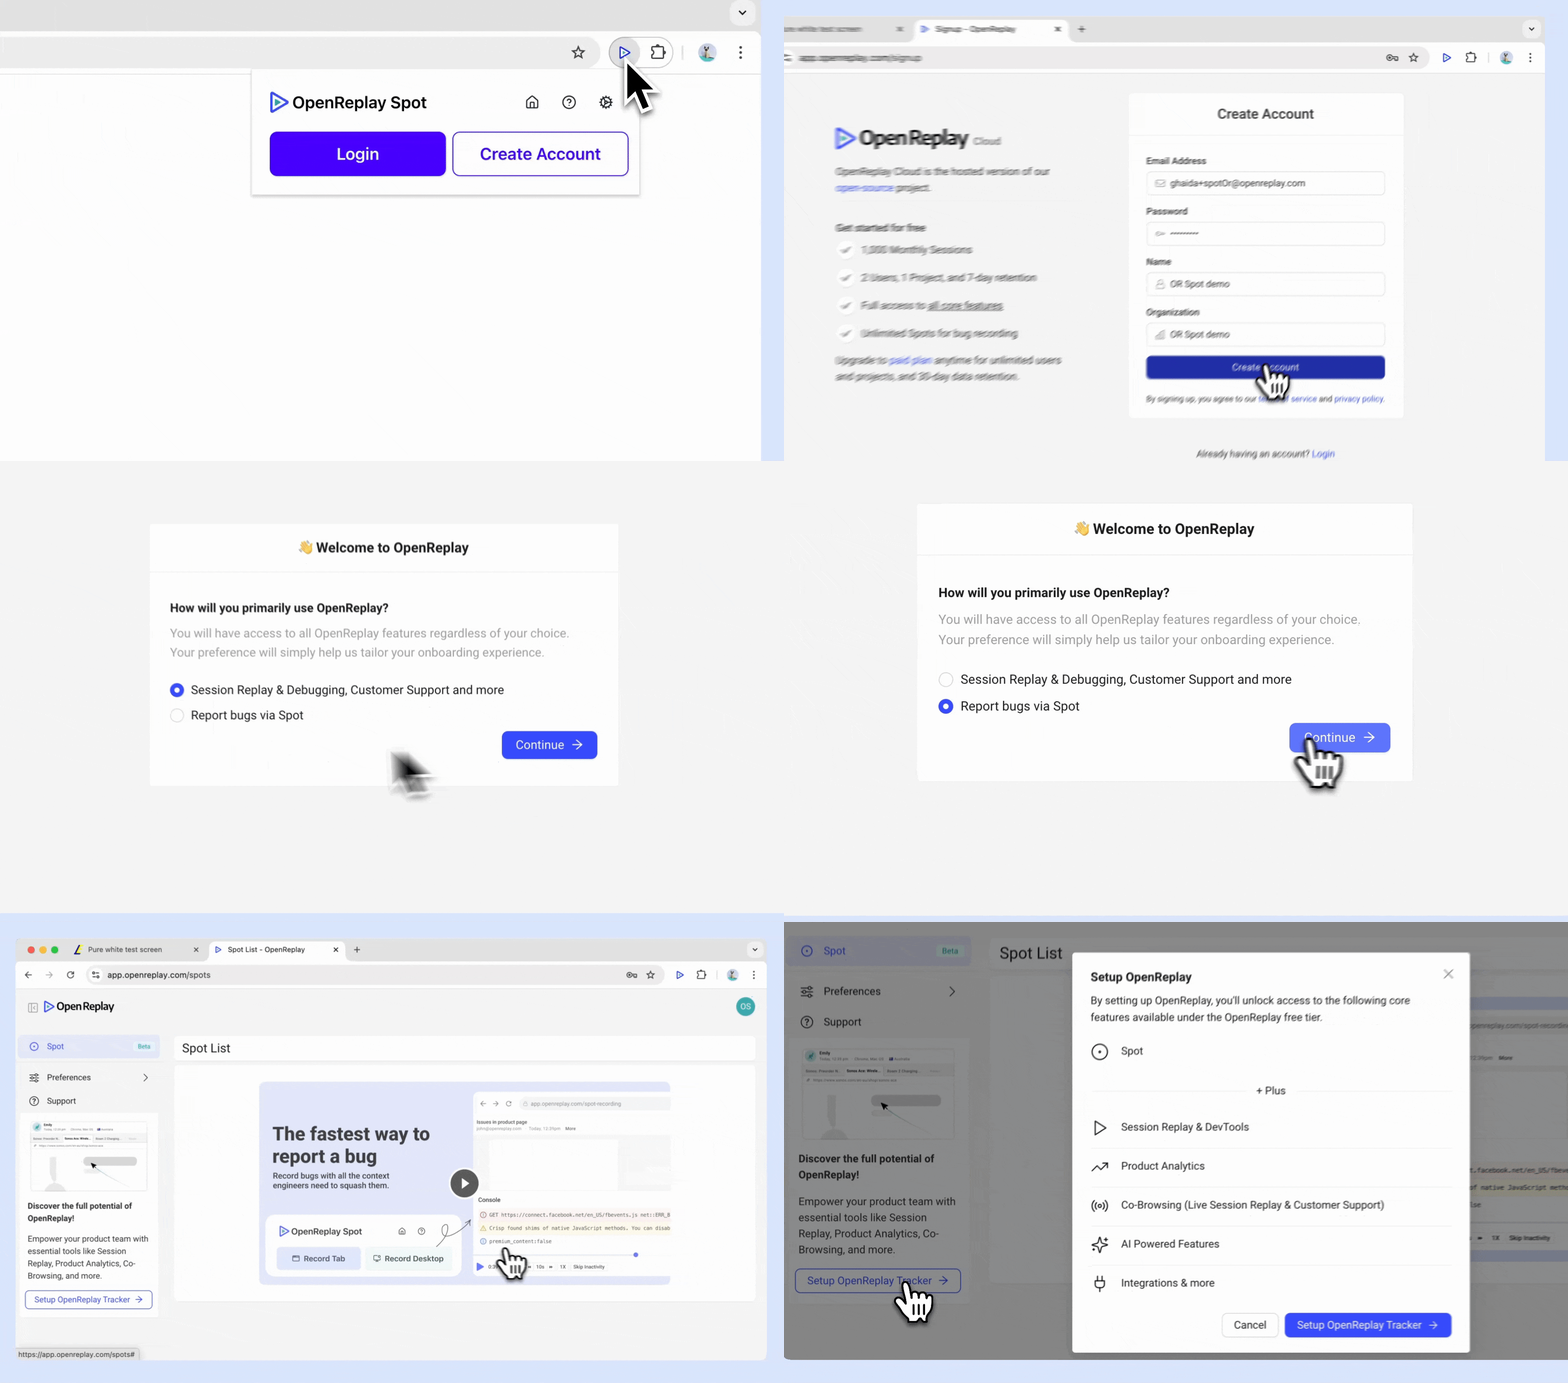
- After pinning Spot, click on the Spot icon in your toolbar.
- Select Create Account.
- Choose your primary use-case for OpenReplay.
- If you select “report bugs via Spot” as your primary use-case, you can later access the full OpenReplay features by clicking on Setup Tracker.
- Existing users:
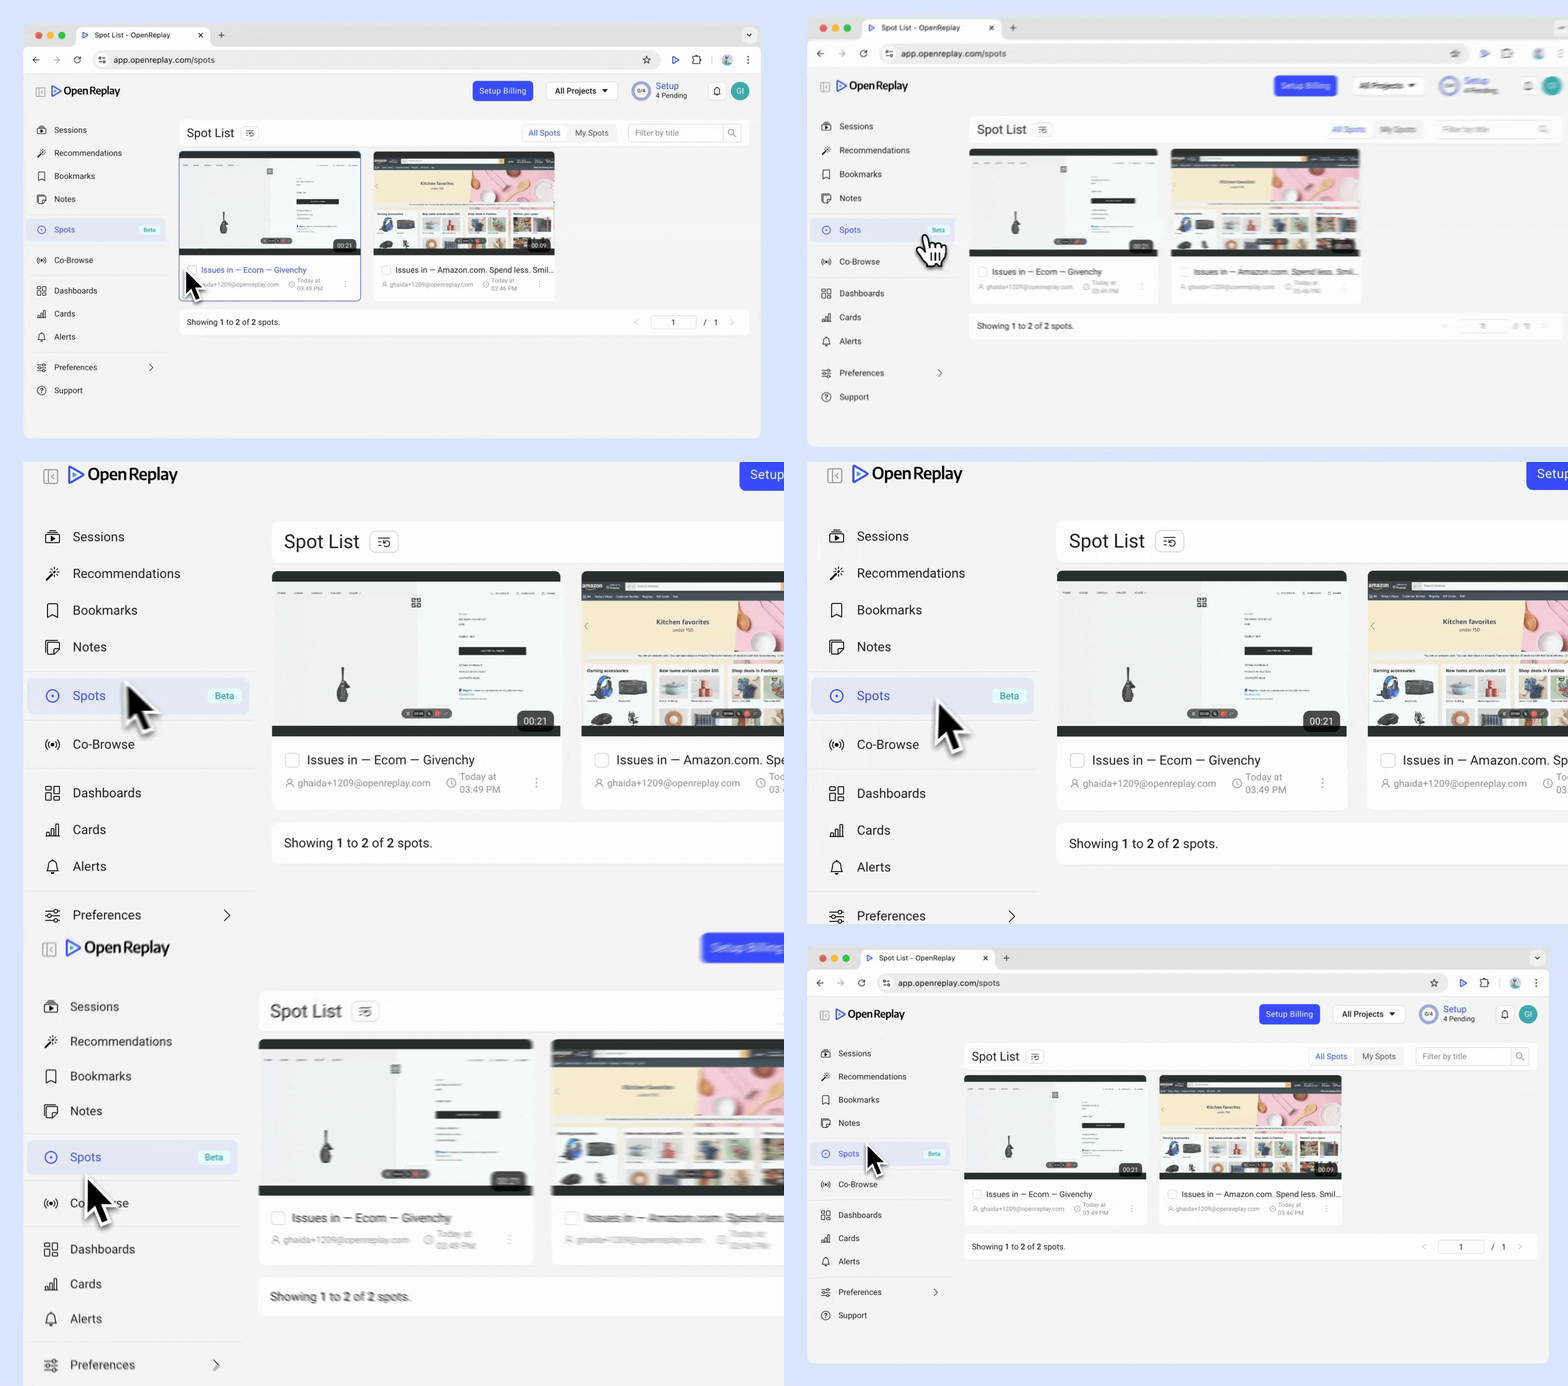
- Click on the pinned Spot extension in your toolbar.
- Select Log in and enter your OpenReplay credentials.
- You can find your Spots in the Spot menu in the left sidebar.
- New users:
-
OpenReplay self-host
Section titled OpenReplay self-host- New and existing users:
- Update your OpenReplay instance to the latest version (v1.20.0) that supports Spot.
- Once updated, the Spot menu will appear in the left sidebar. Your Spots will be securely saved on your instance.
- New and existing users:
3. You’re ready to go!
Section titled 3. You’re ready to go!Now that you’re logged in, you’re all set to start spotting and reporting bugs with Spot.
How to use the Spot Chrome extension
Section titled How to use the Spot Chrome extensionHere’s how to use the Spot Chrome extension’s key features:
Record tab
Section titled Record tab-
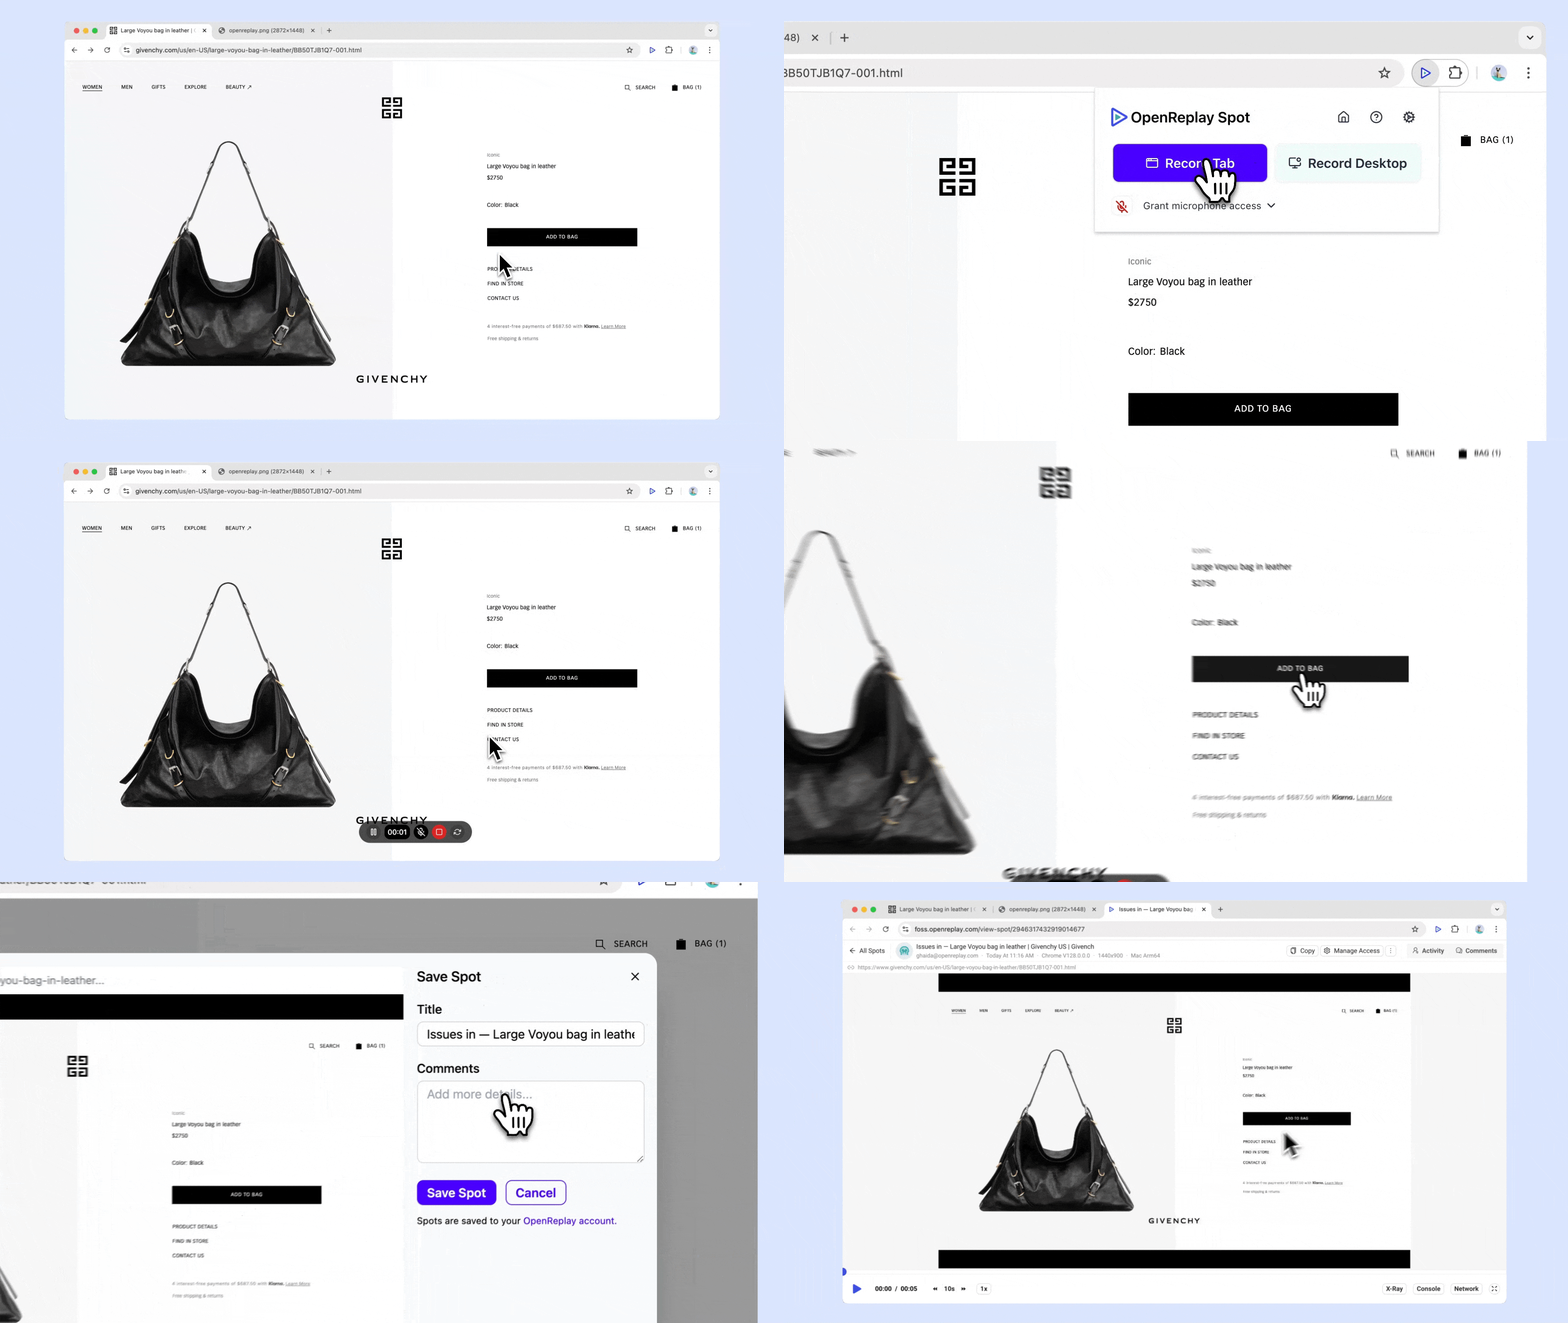
Start recording: Click the Spot icon in your toolbar and select Record Tab to capture everything in the active tab.
-
Enable microphone: If needed, toggle on the microphone option to include audio in your recording.
-
Pause recording: Click on the pause icon from the recording panel at any time.
-
Restart recording: Click on the restart icon from the recording panel to restart the recording.
-
Stop recording: Click on the stop icon from the recording panel to stop the recording.
-
Add comments: You can add comments to provide additional context before saving.
-
Save Spot: After stopping the recording, it will automatically save with all the relevant technical details, like console logs and network data.
Record desktop
Section titled Record desktop- Start recording: Click the Spot icon and select Record Desktop. Choose to record your entire screen or a specific window.
Access DevTools information in Spot recordings
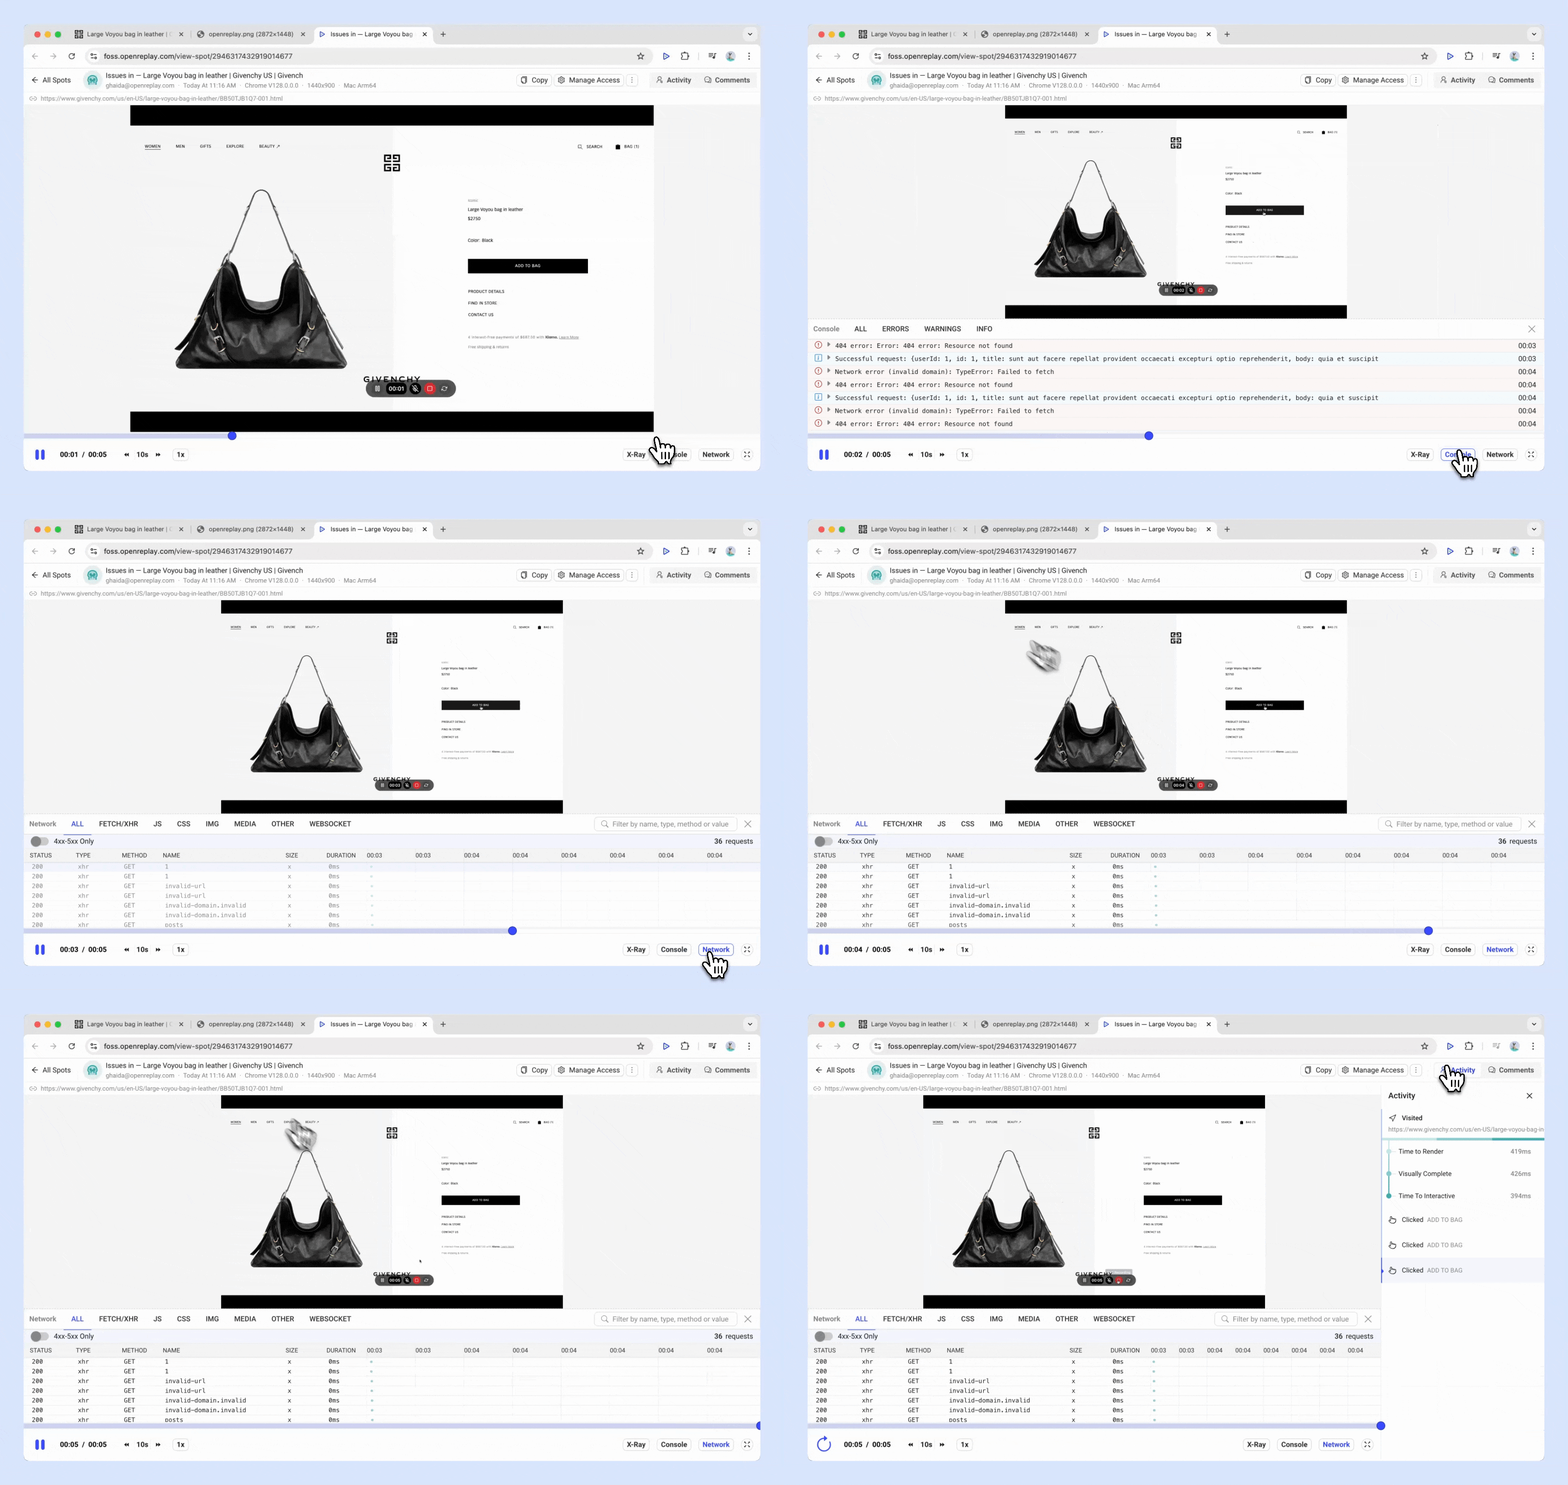
Section titled Access DevTools information in Spot recordingsSpot automatically includes DevTools data in every bug recording, providing your developers with complete context to efficiently debug issues. Each recording captures the following:
- Console logs: All console outputs, warnings, and error messages during the recording session.
- Network requests: Logs of all network activity, including:
- Request and response headers and bodies: Data sent and received in each request.
- Status codes: Quickly identify failed or problematic requests.
- User agent data: Information about the user’s browser and device to help developers replicate the environment where the bug occurred.
- User interaction data: Details about user activity, such as clicks and navigation paths, allowing developers to understand how the issue was encountered.
Note on GraphQL errors
GraphQL typically returns a 200 OK status code for all responses, even when errors are present in the response body (usually placed inside an errors field). This can make it difficult to spot issues based solely on the HTTP status code.
In Spot, we detect when a GraphQL response contains an errors object in the body. When such an error is found, we mark the request with a 400 status code instead of 200. This adjustment makes it easier for developers to identify and debug problematic GraphQL requests.
Spot settings
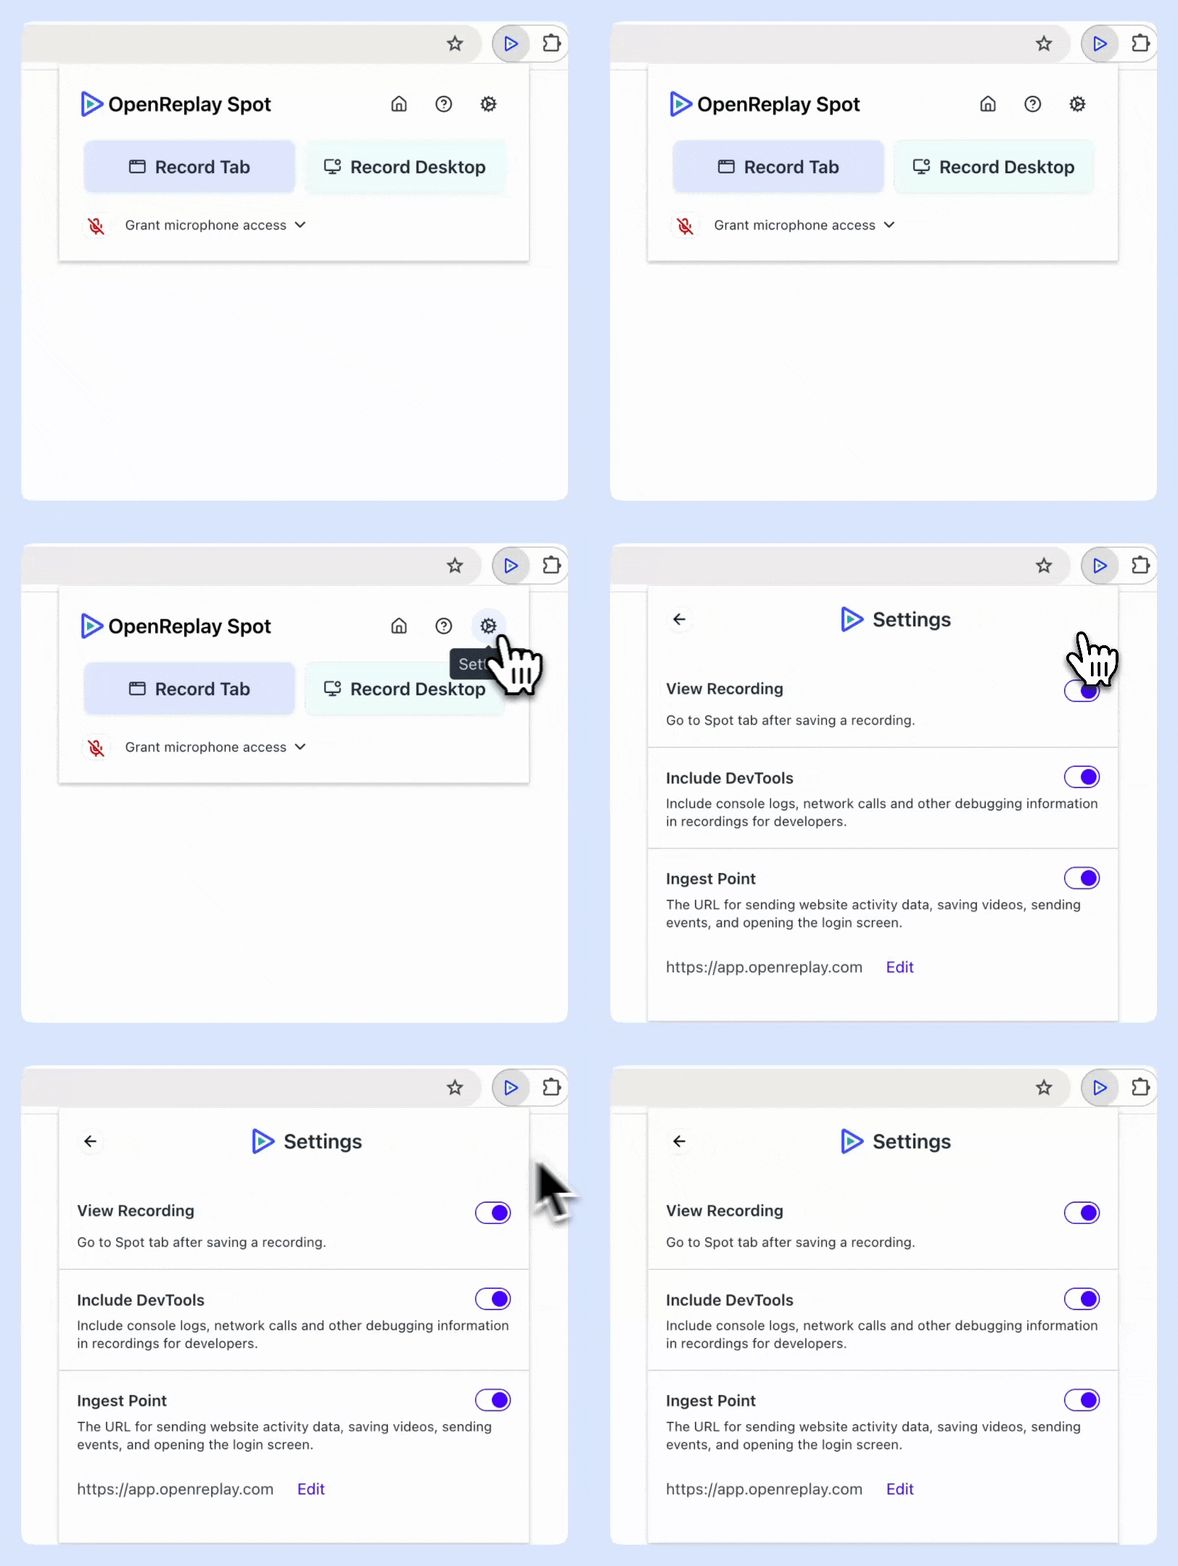
Section titled Spot settings- Access settings: Click the Spot icon in your toolbar and select the Settings icon.
- Go to Spot tab after save: Toggle this on to be directed to the Spot recording immediately after saving.
- Include DevTools: Toggle this on to include console logs, network calls, and other debugging information in your recording.
Invite teammates
Section titled Invite teammates- Send invites: Click Preferences, go to Team, and click Add Team Member. Enter their full name and email address, then send the invitation.
- Team access: All team members can view Spot recordings in the Spots view in OpenReplay
Spots are not tied to any specific project.
Share Spot
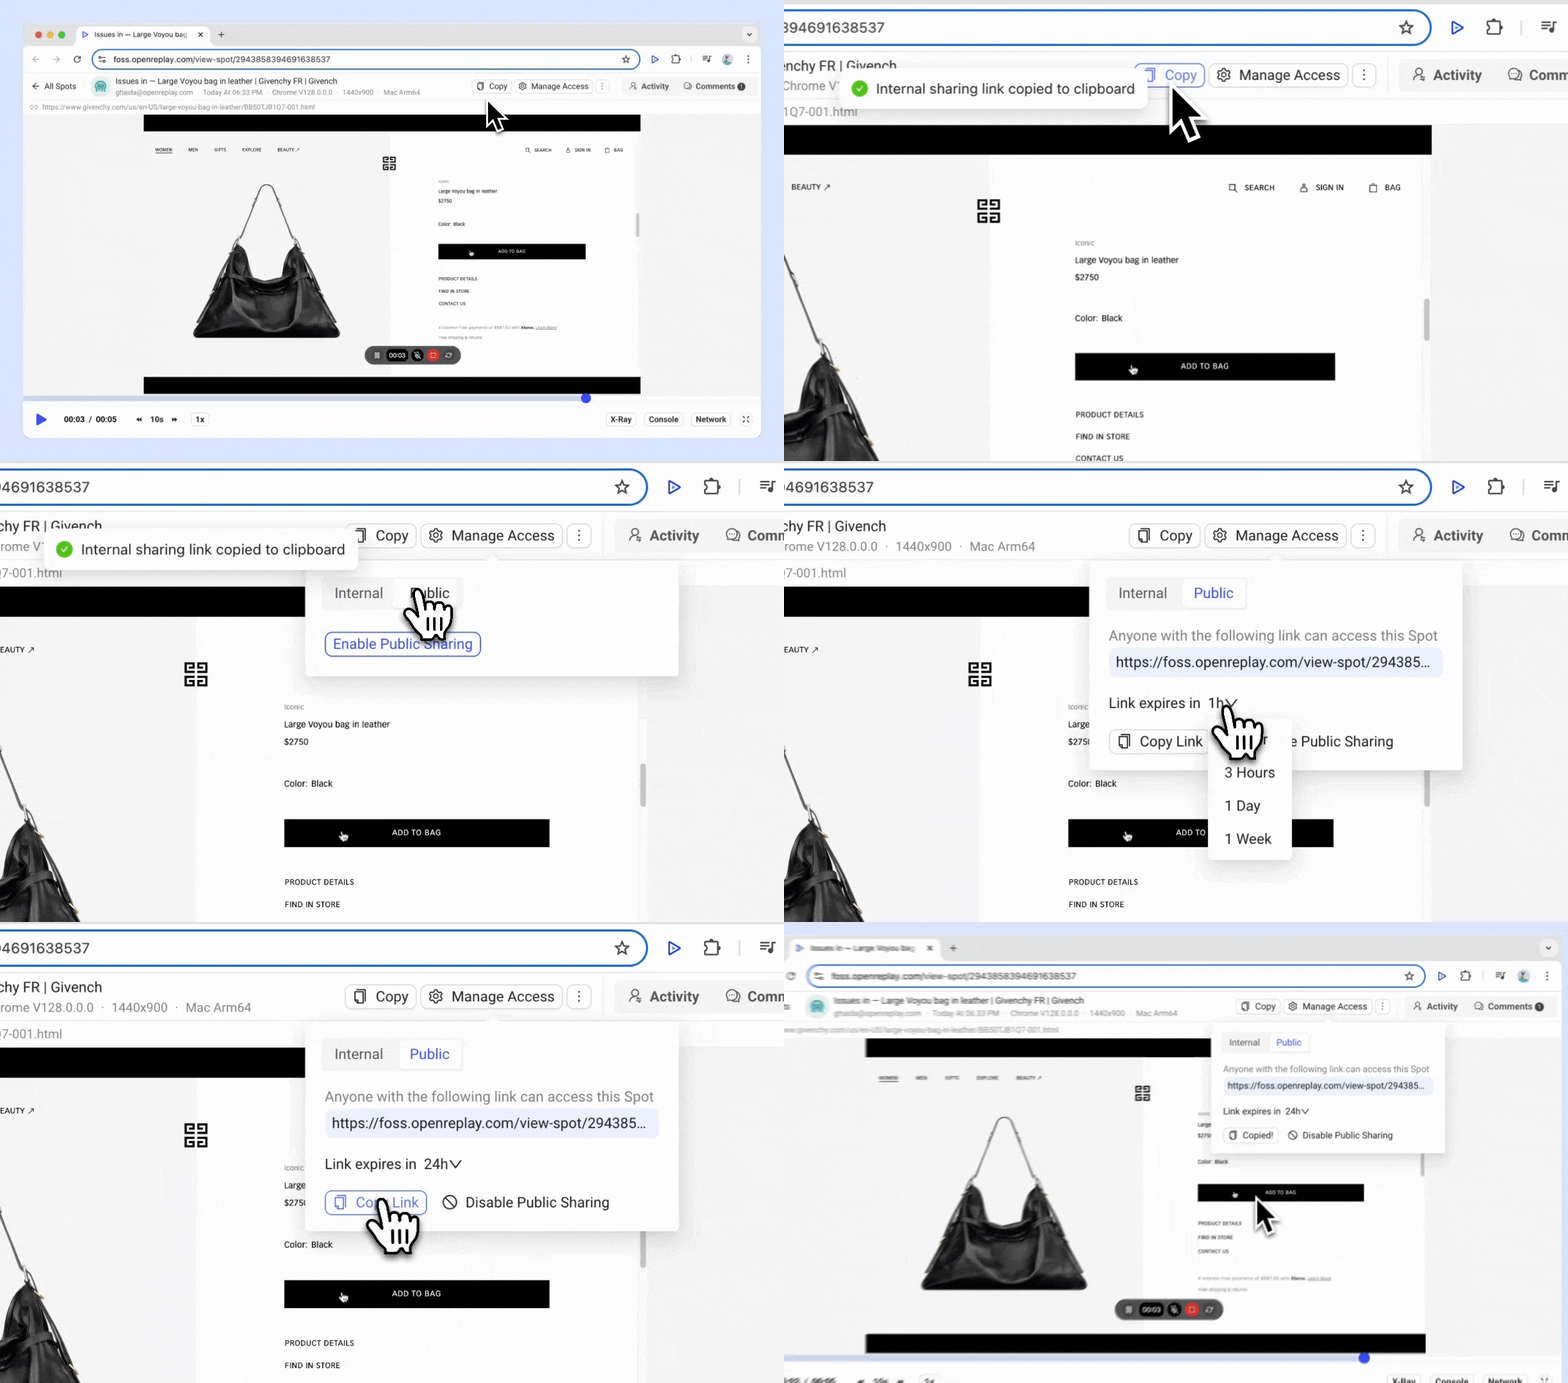
Section titled Share Spot- Private sharing: Spot recordings can be shared via private links for internal viewing within your team on OpenReplay.
- Public sharing: You can create public links for external viewing, accessible even without an OpenReplay account.
- Integration with tools: Include these links in bug tracking or collaboration tools like Slack, Teams, Jira, or Linear for easy access and teamwork.
Have questions?
Section titled Have questions?Having trouble setting up this plugin? Please connect to our Slack or check out our Forum and get help from our community.